Author Archives: Shane L. Larson

Chasing an Evanescent Cosmos

by Shane L. Larson

Humans have looked at the sky for as long as we have inhabited our small, planetary home. For 40,000 generations we have basked in the warmth of our mother the Sun, watched the Moon hurtle across the sky in an ever-changing succession of phases, and fallen asleep as the stars slowly wheeled overhead in their familiar and comforting constellations.

The familiar shape of Orion, with it’s distinct three belt stars, graces the winter skies in the Northern Hemisphere, as it has for all of recorded human history. [Image: M. Larson (iphone!)]

Our perception of the Cosmos is one of steady and dependable clockwork, changing slowly on the timescales of days or months as the patterns of the constellations shift in slow progression with the seasons, but returning to their familiar places in the sky a year later with dependability. Yes, the sky changes, but never dramatically. On the timescale of human history, it is in many ways a dependable constant. The skies I see tonight are just like the skies my grandparents knew, and their grandparents before them.

Comet NEOWSIE (C/2020 F3) graced the skies of Earth unexpectedly in the summer of 2020, during the Coronavirus Pandemic. Comets are one example of rare, transitory experiences humans can have with astronomy. [Image: S. Larson]

There are, of course, events where the sky changes in remarkable and dramatic ways. A bright comet will suddenly brighten and be visible for a few weeks. A distant star will gasp its last breath, and blow off its atmosphere in a cataclysmic nuclear explosion. And sometimes, the Earth and the Moon in their eternal dance around the Sun, will toss their shadows on one another to give us lunar eclipses and solar eclipses.

Any of these events are dramatic enough to have caused consternation in the course of human history, particularly in the days before humans had begun to dissect the patterns of Nature and use that knowledge to better understand our place and purpose in the Cosmos. 

But you and I live in the future. Many before us, both before the birth of modern science and after, have learned the patterns of the sky to such precision that we can predict when the Moon will spin into the line of sight between us and the Sun, and shed a narrow band of shadow on the Earth — a solar eclipse.

A total solar eclipse occurs when the Moon passes between the Earth and Sun. The Moon’s shadow races across the surface of the Earth, blotting out the Sun for those who stand under the racing shadow. [Illustration by S. Larson]

One such moment was this past week, on 8 April 2024. A total solar eclipse was due to roll ashore on the southern coast of Mexico near Mazatlan, then roll northward into Texas, and track along to the northeast through the midwest of the United States, before passing over the eastern seaboard of Canada and out into the north Atlantic.

The path of the 8 April 2024 total solar eclipse, moving from the southwest to the northeast over North America. The centerline is marked in red; everyone in the grey band was within the path of totality.  [Illustration: S. Larson]

Many of us had been fortunate to see a previous solar eclipse that crossed North America from Oregon to South Carolina in August 2017. I saw that eclipse, and wrote about it both the day before, and the day after!  The response that many of us had was a common one that is almost always expressed as a question: “When can I see another one?!

The April 2024 eclipse was a remarkable opportunity for many of us who had asked that question. We could travel to the centerline pretty easily, and the duration of the eclipse was going to be longer than in 2017 — almost four and a half minutes, longer than the two minutes and 27 seconds from 2017. It doesn’t sound like much, but some deep part of our soul knows that longer matters. 

That’s because standing in the shadow of the Moon, your mind knows something remarkable is happening, but it is far outside your everyday experience. It is difficult to grasp and hold on to and put into words. You have a lifetime of experience with the Sun — it is steady and reliable and is the same every time you see it. You never see it do something unusual, and your brain knows it.  When the Sun disappears, and is replaced by an inky spot of darkness in the sky, you feel it deep down in your soul, and you want to hold on to that memory and feeling — it is precious.

A message from a friend of mine about the experience of standing in the utter darkness of totality during a solar eclipse. [Shown with permission]

The impetus for many adventures are some friends who are keen on the experience, but want to share it with someone else. Sharing gives you the opportunity to talk afterward, a chance to draw out the gossamer threads and cement those few magical moments in your memory. It was no different for us. It began with a simple plan that was just a few people, but rapidly swelled until we were just a tidge more than 30. Old and young, children and parents, millenials and old hippies. A motley crew that was a skein of linked acquaintances, soon to become a band of friends who experienced one of Nature’s great spectacles together.

But from where? 

A site was selected based on historical weather averages. April is springtime in North America. Along wide swaths of the eclipse track that means turbulent weather, spring rains, occasional snows, and cloudy days as Spring tries to assert herself over Winter. For many, this is a once-in-a-lifetime event, so you play the odds. We, like many others, descended on Texas.  

The historical cloud cover in North America on 8 April, generated from 43 years of data.

We settled on an RV park in the Texas hill country, west of San Antonio, on the banks of the Rio Frio just outside Garner State Park. If you were to pick an awesome site for the eclipse, this was the one.  Right along the centerline. 

We converged on Saturday, two days before the eclipse, and the forecast was looking grim. Predictions for Eclipse Day on Monday were for 90% clouds, possible rain. Quite against all odds, the northern reaches of the eclipse track, historically cloudy in April, were predicting clear skies! 

The cloud forecast from the Washington Post on 5 April, just three days before the eclipse!

The agony of statistics!

There was a lot of hand-wringing around the firepit that evening, and long into the next day. What should we do? Should we stay put? Should we try and drive to clear skies? It was predicted only 50% cloudy three hours north — were those odds we liked? It was predicted only 10% cloudy nine hours north in Arkansas? Did we want to do 18 hours on the road (there and back)? What if we got caught in traffic and missed everything? 

In the end, we decided to stay put. The magic of the moment was being together, and there was still an experience to be had. Even on a cloudy day, it was still going to get unnaturally dark. Maybe we’d get lucky, and maybe we wouldn’t. 

Eclipse day dawned cloudy, as predicted. But Nature is a tease. The clouds were layered, and moving in different directions, and every now and then there was a fabulously clear blue spot, sometimes in front of the Sun — shadows would sharpen and we could feel the warmth on our faces, tantalizing moments of hope.

We had an eclipse talk before the event, to answer questions and help everyone feel like they were prepared. [Image: M. Mesel]

We gathered about an hour-and-a-half before the eclipse, together with more than a hundred people camping at the RV park, and talked about what eclipses are, and how and why they happen. We reviewed how to see the event safely, and made sure everyone had eclipse glasses. And lastly, we talked about what to expect and experience, clouds or not.

Then we all dragged our camping chairs to a wide grassy spot, and waited. The clouds were thick, but there were gaps that dashed across the sky, and moments where we could make the Sun out through the clouds, and other times it stood in the clear sky.  Eclipse glasses pressed tightly to our eyes, we could see the Moon had started the eclipse run and was dutifully eating more and more out of the right side of the Sun.  

Our eclipse expedition crew, waiting for totality on 8 April 2024.

First we could see just a little tentative nibble, and then a cloud would dash in front and obscure the view. But just a tiny bit later, the Sun would emerge again, and joyous cries of amazement would rise up from the sea of chairs as people witnessed the Sun slowly disappear.

Our views of the ongoing eclipse through eclipse glasses (left) and through the cloud layer (right). [Images: S. Larson]

As the last few moments approached, the Sun had become a thin crescent, a mimic of how the Moon sometimes appears. But we could see dark skies ahead. A massively thick cloud was rolling our way, with all possible ill-timing. It was roiling and dark, no breaks to be seen anywhere. It moved in front of the Sun, barely a minute before totality began. 

We could feel the chill on our skin. Was it the ever fading light from the Sun, now obscured? Or was it the cold embrace of weather carried on our nemesis, The Cloud? 

The Cloud, the nemesis of our expedition. [Image: S. Larson]

Totality was approaching, not a break to be seen. Dutifully linked to the digital world, we had GPS times on our phones, and precise knowledge of when Totality should occur, now on the far side of The Cloud. About 20 seconds before Totality, a swelling countdown rolled across the sea of people…

20 – 19 – 18 – 17 – 16 – 15 – 14 – 13 – 12 – 11 – 10 – 9 – 8 – 7 – 6 – 5 – 4 – 3 – 2 – 1 – 0!

Right on cue, the skies descended to darkness. What was moments before a cloudy day illuminated by dim filtered sunlight, plunged into darkness. People erupted in applause and cries of joy.

Totality descended on us, right on schedule. Dark as night, but it swept over us in mere seconds. [Image: S. Larson]

We strained to see a break in the clouds, but there were none. We looked hither and thither, drinking in the darkness around us. Everyone around was atwitter with things they were noticing, calling them out to everyone else, so we could all share in the moment.

The automatic streetlight at the entrance to the RV park came on. The birds got quiet. Bats started flitting overhead. The humans were still taking pictures. We craned our heads around, and could see that near the horizons, it was still light — realms outside totality, where the light still fell. But where we were, it was dark.

For 4 minutes and 28 seconds, we were in the Shadow of the Moon.

We stood in totality, and could not see the Sun nor the gossamer aura of its corona. But still we stood in the darkness in wonder. [Image: S. Larson]

Together, we basked in  a few moments of darkness. For a few precious minutes, the world did something completely unusual — something our rational minds could process and understand, but something deep down we knew was unusual and different and ephemeral. To share it with friends is an essential part of experiencing the event as humans, so that you can together process and understand what the event emotes within us.

And then, it was over as quickly as it had started. The light rose, and we were once again sitting in a grassy patch on a cloudy spring day, the soft light of the Sun filtered by clouds above. Except we were different. For a long while, we stayed put. Comparing experiences, taking selfies, laughing, and sharing the joy.

Post-eclipse reverie, with friends and song. [Image: Z. Mesel]

Later that night, after normal darkness fell, we sat in a great circle in the middle of the camp, and engaged in another time-honored human tradition of sharing songs and music. Songs of the sky and moonshadows, songs of sharing and family, and songs of learning and travelling home. Picked out on the strings of a guitar, with some voices well-trained and other voices simply happy to be together, we bonded just a little bit more to ensure that we each remembered how special that day had been.

For some of us, there will be other eclipses. Perhaps with clouds, perhaps without. But for all of us, there were four and half ephemeral minutes of darkness that we shared, on the middle of a cloudy day in southern Texas.

An Ephemeral Whisper in the Cosmic Dark

by Shane L. Larson

In a 2012 article in Esquire, the inimitable American magician Teller noted, “Sometimes magic is just someone spending more time on something than anyone else might reasonably expect.” 

This past week, the world was greeted with the news that a worldwide collaboration of scientists, in a multiple collaborations, made a magical announcement: they have detected a faint gravitational hum coming from the Cosmos, created by pairs of super-massive black holes, strewn across the Universe, dancing around each other in slow, languorous orbits that shed gravitational waves. 

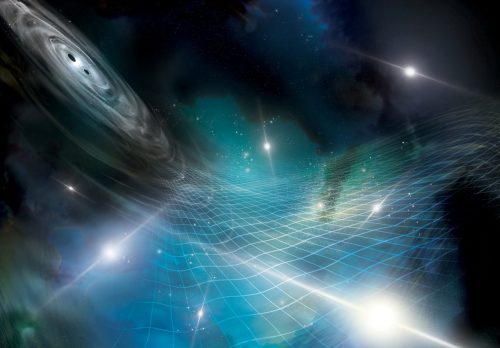
An artistic interpretation of an array of pulsars immersed in gravitational waves from a distant supermassive black hole binary. [Image: Aurore Simonnet/NANOGrav Collaboration]

Like most newsflashes from the frontiers of science, the announcement is a magical moment, instilling deep wonder and inspiring an endless barrage of questions about what it means, how was it found, what does it tell us about other mysteries of the Cosmos, and why does it matter to us down here on Earth? The magic and the wonderment stem from the bigger than life nature of the discovery, far removed from the trials and tribulations of day-to-day existence on Earth — a reminder that we are part of something far larger than ourselves. But for the scientists around the world who made the discovery, it’s what Teller said: the discovery is the culmination of decades of work, the result of spending more time on this particular mystery of the Cosmos than anyone else.

Let me tell you three things about this remarkable achievement.

[1] What is a “nanohertz gravitational wave background”?

This tale begins with the idea that nothing in the Universe has to only be found leading solitary monastic lives, drifting along in the vast void. Very often, objects can find each other (or are born together) through their mutual gravitational attraction — this includes, stars, planets, asteroids, galaxies, and as it turns out, black holes.

We know from long, detailed studies of the sky with telescopes two remarkable things.

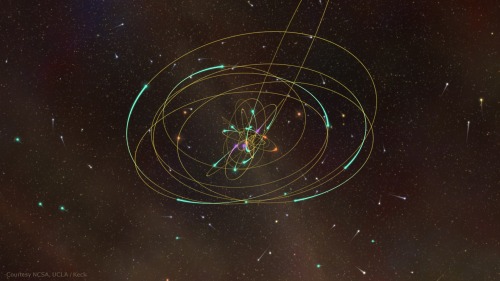
Two decades of observations have shown the orbits of stars around the supermassive black hole at the center of the Milky Way. Observations like these earned Andrea Ghez and Reinhard Genzel their share of the 2020 Nobel Prize in Physics. [NCSA/UCLA/Keck]

First, we know that most galaxies have at their hearts a massive black hole, millions or billions of times more massive than a single star. If you are a science fan, you’ve heard a lot about this recently, from the 2020 Nobel Prize in physics awarded for precise measurements of the enormous black hole at the center of the Milky Way. You have likely also heard of a remarkable picture taken by the Event Horizon Telescope collaboration, showing the silhouette of a massive black hole in the galaxy M87, an inky void against the glowing light of the gas that surrounds and feeds it.

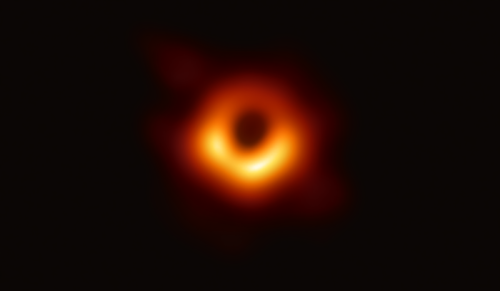
The first picture of the black hole at the heart of M87, formed by light being bent around the inner most regions of space outside the black hole. [Image: Event Horizon Telescope Collaboration]

Second, we know that galaxies collide. One of the most spectacular examples of this are a pair of galaxies known as “The Mice,” slowly tearing one another apart as they merge over the course of a billion years. Another example is a remarkable ring galaxy known as Hoag’s Object, the result of a small galaxy dropping through the heart of a larger companion and leaving a beautiful geometry in place, like the spreading ring from a stone dropped in a pond.

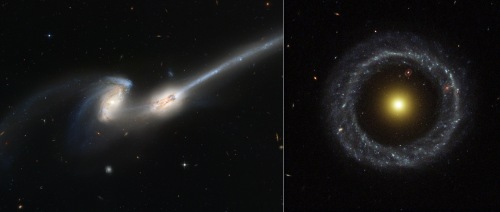
Examples of the consequences of galaxy collisions. (left) A pair of galaxies mid-collision, known as “The Mice”. (right) A ring galaxy known as Hoag’s Object. [Both Images: Hubble/STScI/AURA]

These two bits of knowledge  leads to a lovely question: what happens to the massive black holes in a galaxy when two galaxies merge and combine? The expectation has long been that the black holes would slowly sink to the center of the new combined galaxy, eventually find one another, and merge to become a newer, bigger black hole. That process of finding one another and slowly spiraling together to become one takes a long time.

When the black holes do find one another, they dance around in an orbit, not unlike the orbits of the Moon around the Earth. Long before the black holes make their final crash, those orbits are large and can take many decades to complete. During this time, as they warily spiral around one another, they are constantly changing the parts of the Universe they are bending with their gravity, and that change ripples out through the Cosmos as “gravitational-waves.”

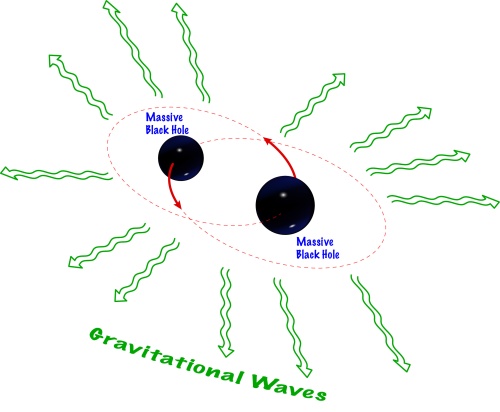
As massive objects orbit one another and get closer and closer together, they emit gravitational waves in all directions. [Image: S. Larson]

Sitting where you and I are sitting in the Cosmos, the gravitational-waves from any one of these black holes will wash through our galaxy, but only one complete wave from the black holes will pass over the course of many years. There are about a billion seconds of time that elapse every 30-ish years; if a complete gravitational wave takes 30 years to pass by, then each second means one-one-billionth of a gravitational wave passes by. Scientists abbreviate the amount of “one-one-billionth” with the word “nano-” which comes from ancient Greek meaning “very small.” Nanohertz gravitational waves are waves so large it takes several decades for them to pass by.

Which brings us to the last word, “background.” This is a bit of scientific jargon, but it describes a phenomena that most of us are likely familiar with. Consider the last time you were out shopping, or at a high-school basketball game, or in a crowded restaurant. Immersed in a crowd of hundreds of people all carrying on conversations and laughing, you were immersed in a cacophony of sound. You could certainly hear the person next to you (with whom you were probably discussing the discovery of the nanohertz gravitational-wave background), but all the other conversations are overlapping and blended into the “background.” The gravitational-wave background is the same way — there are so many pairs of massive black holes strewn across the Cosmos, all of them shedding gravitational waves, that the cacophony of them merges to form a faint hum of indistinguishable signals.

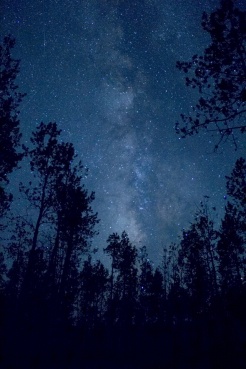
From dark sites far from cities, you can see the Milky Way in the night sky overhead, as in this image over the Pando Forest in Utah. [Image: Shane L. Larson]

This idea of overlapping indistinguishable signals becoming a faint, detectable signature of the Universe is not unknown in astronomy. If you have ever had the good fortune to go camping, far from the glaring lights of our cities, and looked up to see the vast tapestry of the sky over you, you’ve likely seen the river of the Milky Way, arching overhead from one side of the sky to the other. A faint, gossamer glow of light that when you first see it may have reminded you of clouds or fog. But it is no such thing — the Milky Way is the combination of the light of a hundred billion stars in our home galaxy, each too faint to see individually, but together they make a faint light your eye can detect. The gravitational wave background is the same idea, just with gravitational waves instead of light.

[2] How was the nanohertz background detected?

You may have heard of gravitational-wave observatories before (LIGO, and LISA), but this new discovery was made with a remarkable technique known as pulsar timing, where we mesh our own modern technology with natural phenomena from Nature to create a galaxy-spanning gravitational-wave antenna array.

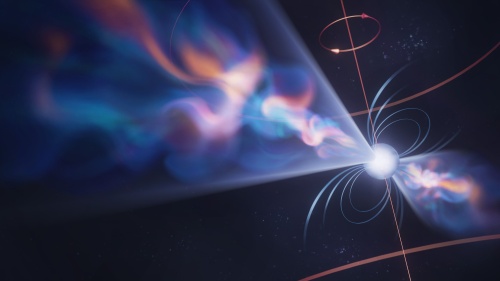
Artist’s rendering of a pulsar – a rapidly rotating neutron star that emits a beam of radio light that passes the Earth once every rotation. This results in a detectable pulse from the star, hence the term pulsar. [Image: Olena Shmahalo/NANOgrav]

It begins with dead stars — stellar skeletons of a particular type called a pulsar. Certain stars, when they reach the end of their lives, explode and leave behind a cinder of their former selves, roughly the size of a city (about 20 kilometers across), but containing the mass of about one-and-a-half times that of our own Sun. Like most things in Nature, these stellar skeletons are rotating. What makes a pulsar “pulse” is it has a very bright beam of radio light it is spewing out of a point on its surface — as it spins, it sweeps that radio beam across the sky, and everyone in the right place sees a bright pulse as the beam goes by, and then nothing, and then a bright pulse, and then nothing — a cosmic lighthouse jetting its signal across the Universe.

Astronomers create pulsar timing arrays (PTAs) by using radio telescopes on Earth to monitor a large collection of pulsars every now and then for decades. Today, there are several such collaborative enterprises on Earth: NANOgrav  in North America, the European PTA in Europe, the Indian PTA in India, the Parkes PTA in Australia, and an overarching global collaboration called the International PTA. Each of these collaborations watches their set of pulsars, and records with exquisite precision what time each of the pulses arrives at Earth.

Because each of the pulsars lived their own lives, in their own little corner of the galaxy, we expect there to be nothing about any of the pulsars that is related between them — in the absence of anything going on, each their signals arrive at Earth at a predicted time defined by the pulsar and where it is relative to Earth. Nothing is correlated (in the literal sense of the word) between the pulsar signals.

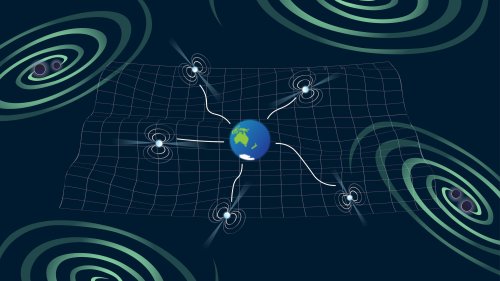
An artist’s impression of a pulsar timing array, immersed in a sea of gravitational waves from supermassive black hole binaries outside the galaxy. [Image: Shanika Galaudage]

However, if you are timing many different pulsars, and a gravitational-wave passes through the galaxy, then a subtle pattern emerges. When a gravitational-wave passes between you and a pulsar, it stretches the distance and then it compresses the distance as the wave passes by. When the distance stretches, it takes longer for the pulsar signal to travel to Earth, and in your timing the pulses seem to arrive late. When the distance compresses, it takes less time for the pulsar signal to arrive at Earth, and in your timing the pulses seem to arrive early. But the magic is this: the gravitational-waves are passing through the Milky Way, and changing the spacetime between us and every single pulsar being timed! That means before, where nothing was expected, there is now a unique and detectable correlation between all the pulsars in the timing array!

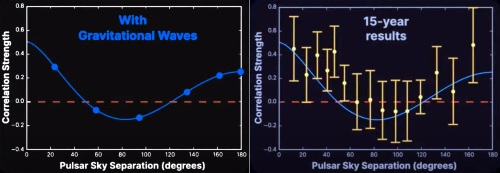
Summary graphs of the results from NANOgrav. The curve shows the correlations between pulsars in the array due to gravitational waves. (left) The red dashed line is how “uncorrelated data” from pulsars looks. The blue curve is the expected relation between pulsars when gravitational-waves pass by, known as a “Hellings-Downs curve.” (right) The same curve, with NANOgrav’s data overlaid. [Image: NANOgrav]

How long does it take for all these changes to happen and be noticed? The time it takes the gravitational wave to pass, which for the super-massive black holes can be many, many years. Which is why it has taken so long for astronomers to diligently time and retime all the pulsars in the array, and extract the ephemeral signal of the gravitational-wave background from the data.

[3] It’s really about people.

Science is often a long game, particularly science that probes the limits of human knowledge, and science done with advanced technology and tools that can’t fit in your pocket or on a laboratory bench. It takes hundreds and thousands of minds to conceive of what is possible, and then unflagging tenacity to solve each of the problems that arises until — in the end — a remarkable discovery is made. That long and arduous process means that people come and go, as they follow their own winding pathways to careers and life. But it also means we lose some people along the way who pass on, returning to the stardust from which we came. Here, I’d like to draw attention to just two of those people.

The first person was Ron Hellings. Ron is the Hellings of the “Hellings-Downs” curve, the swooping pattern of correlated signals from the scattered beacons in the pulsar timing array. He and his collaborator, George Downs, first wrote down what that pattern would look like and what pulsar astronomers should look for in a paper in 1983; it was only this week in 2023, forty years later, that their idea came to fruition.

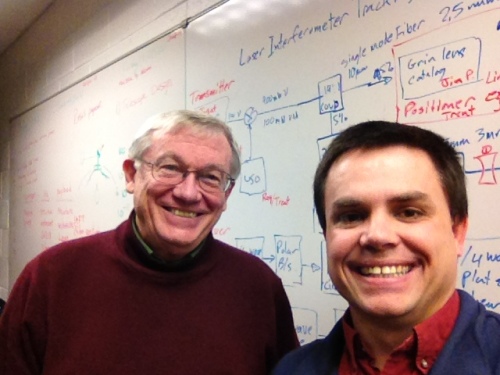
Me and Ron Hellings in 2012, working on the details of a gravitational-wave observatory. [Image: S. Larson]

Sadly Ron passed away on 1 January 2022. At his memorial, when we talked about the important things Ron had discovered about the Universe, the Hellings-Downs curve was one of them.

I have the good fortune of being one of Ron’s academic descendants. I first met him when I was working on my PhD thesis, where we were thinking about the LISA gravitational-wave observatory. It was the beginning of a collaborative enterprise and a friendship that spanned a quarter of a century. We worked on many things together, including LISA, how to think about gravitational-wave signals, how to teach students, and a zillion other things in physics and astronomy. After I finished my PhD I spent two years as his postdoc, when he was at the Jet Propulsion Laboratory. It was an exhilarating and exciting time, and firmly set me on the path of my career today.

The second person was Steve Detweiler. By the time I was in graduate school, in the late 1990s, Steve was already famous in our community. Like most of those famous people, he was larger than life to us students, but he was always friendly. At meetings, he talked with us at coffee breaks, came to our talks, and sometimes went to dinner with us. I knew Steve for many years after we first met, and we would talk at conferences and meetings where our work on gravitational-waves overlapped.

Steve Detweiler. [Image: Eric Poisson]

Steve was well known for many things in his career, but in the late 1970s he was the first person to propose that pulsar timing could be used to search for gravitational-wave backgrounds; in no uncertain terms, his original analysis sent us down pathway to the discovery that was announced this week. 

Steve sadly passed away on 8 February 2016, just three days before the first announcement of the discovery of gravitational waves, and seven years before this week’s announcement of the confirmation of his idea for how to sense the Cosmos anew.

For me, Steve was more than a scientific acquaintance. There came a time when I had to prepare my dossier for tenure as a University professor. The process involves a robust independent evaluation of a person’s contribution to the scientific enterprise. For part of it, the University asks several experts from around the world to make a blunt assessment about the tenure dossier. I got to pick two people, and the University picked four; needless to say it is a terrifying prospect, especially for those of us who don’t have the global stature many of our colleagues have in the field. But I asked Steve to write one of my assessments, and he agreed. I have no idea what he said (his letter was confidential), but whatever it was, the University tenured me, and I owe Steve a great thanks. 

My stories and relationships with these senior scientists in the field are not unique — all of us have been encouraged, mentored, and brought into the great adventure of science by colleagues like Ron and Steve. At the NANOgrav press conference, our colleague Maura McLaughlin pointed out that the NANOgrav collaboration involved hundreds of graduate students, undergraduates, and even high school students. Every one of these contributed their time, their unique enthusiasm and energy, and their skills to making the discovery happen. 

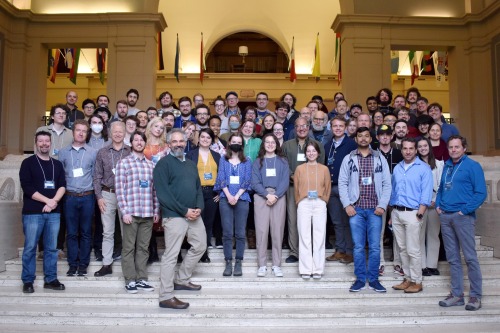
Not everyone, but some of the members of the NANOgrav collaboration at a recent meeting. People make science happen. [Image: NANOgrav]

The scientific work kept them in the game, growing their skills and propelling them on to whatever is next in their personal journeys. Some of them will go on and become pulsar-timing gravitational-wave astronomers, to be sure. Some will not, but will still become astronomers or physics professors and mentor students of their own. But not all of them — a good many of them will become teachers, or doctors, or engineers, or business leaders, or accountants, or any of a thousand other careers that make the world go round. And in them all, some of what they learned as part of the pulsar-timing-array community will go along with them.

In the end, it’s all about people, and that is the true legacy — the true magic — of the wondrous discovery of the nanohertz gravitational-wave background.

My heartfelt congratulations, respect, and admiration goes out to all my friends and colleagues who made this discovery possible. Excelsior!

The Hardest Thing About Science II: Nouns & Verbs

by Shane L. Larson

Friends and family who travel around with me know I have a fatal weakness for one of the most ephemeral manifestations of the human brain: museums. Museums ostensibly exist for the singular purpose of capturing and showing what we as a species have learned, what we have discovered, and what still gives us wonder about the vast and mysterious world around us.

A “Little Free Library,” one of the modern forms of libraries, found in neighborhoods around the world.

In many ways, they are like their sister institutions, an equally ephemeral result of our unique brains: libraries. Libraries ostensibly exist for the singular purpose of storing the knowledge our species has accumulated, dispersed freely and at will to anyone who walks through the doors. I have a fatal weakness for libraries as well.

What do I mean by fatal weakness? I mean if I walk into one of these spaces, I’m consumed by it. In a museum, I linger and dwell at every exhibit, I read the detailed descriptions, I go back to previous exhibits to see how it is all connected. In a library, I walk down the aisles brushing my fingers lightly over the spines of books, drinking in the titles, sometimes pulling one off the shelf to thumb through the pages.

Every now and then, I ponder why we first decided to create these museums and libraries. Often when people think about museums and attempt to describe them, they describe the things there: artifacts, rocks, shards of lost civilizations, exquisite pieces of art, stuffed creatures that once roamed the wilds. 

Consider what you might see if you visit the Adler Planetarium in Chicago. There you can see a star show on the planetarium dome, touch a fragment of the dwarf planet Ceres with your own bare hand, see a life-size model of the Opportunity rover on Mars, and stand next to the Gemini 12 capsule that carried Jim Lovell and Buzz Aldrin around the Earth for almost four days in 1966. 

The Gemini 12 capsule, on display at the Adler Planetarium in Chicago.

But these are all things, and while the things are a focal point that draws you into the museum, they are not why you are there. You stare, and linger, and imagine something quite different and ephemeral. What is that? 

Dr. Michelle Larson, the President of the Adler, describes this dichotomy  as “nouns” and “verbs.” The nouns are what attract our attention, but what we are looking for and hoping to find are verbs. 

Standing in front of Gemini 12, a thin pane of plexiglass keeping you barely a half meter away, you reach out your hand. What are you doing? Hoping to verify the construction of aluminum? Check that the paint is peeling? No, much more. 

Closeups of the Gemini 12 capsule, showing the cramped space of the crew cabin (left), and the scorched heatshield (right).

The almost involuntary movement of your hand is because your brain is imagining what it was like to hurtle through the vacuum of space at nearly 28,000 kilometers per hour (more than 17,000 miles per hour), protected by the thinnest veneer of metal and insulation — was it terrifying or exhilarating or both? You look at the tiny window, and try to imagine seeing the color and light that was seen as the capsule plummeted down to Earth on the way home. The blast pattern of char on the back of Gemini 12, where the heat shield protected Lovell and Aldrin from the 2700 degree Celsius inferno, makes you wonder: if someone touched the window would it feel warm? Staring at the tiny confined space where the astronauts lived for almost four days you wonder: did it smell in there?

The Gemini 12 capsule, the noun, is just a vehicle to stimulate your thinking about the experiences, the verbs

This spills over into hobbies. Consider birdwatching. For some of us, birds are sortable at best into “robins,” “ducks,” and “little brown birds.” But for people who identify as birders, there is a certain unconstrained joy that people find in seeing the widest possible variety of our feathered friends as they can. They meticulously stare at birds through binoculars in the backyard, slog down park trails to remote copses of trees, and diligently put food and water in the backyard, all to be afforded a chance to see a blue-winged teal, or an eastern meadowlark, or a tufted tit-mouse.

A collection of birds from the winter in Illinois. A bluejay (top left), a tufted titmouse (lower left), and a cardinal (right). [Photos: M. Larson]

The birds are nouns, but birders aren’t collecting birds. They are collecting the experience of seeing birds, the verbs of birding. Birding is a verb! The joy is seeing the delicate splash of color of feathers iridescent in the sun, of projecting your own joy on a bluejay who looks thrilled to have a peanut in its mouth, or hearing a mother cardinal squawking at her fledglings encouraging them to take wing for the first time.

Looking at the Moon through a telescope or binoculars always fires the imagination. [Photo: S. Larson]

Amateur astronomers are the same way. We stand out in the backyard, hunkered down in our winter jackets against the cold, peering intently into the eyepiece of a telescope, straining to see photons that have spent two million years sailing the void from the Andromeda galaxy to Earth. The telescopes, the photons themselves, are just nouns. They are cool things unto themselves. But the astronomer is experiencing the light, drowning themselves in the existential awe of imagining the enormous gulf that photon has crossed to ultimately fall into their eye. Perhaps the light originated right next door, on the Moon, or perhaps it started its journey long, long ago far across the Cosmos in a star in a galaxy so far away humans haven’t named it. That light journeyed for longer than humans have been on Earth, and ended its voyage rattling through a few telescope mirrors and terminating on the retina of an eyeball. Imagine the journey that light took. 

All of the practice of science can be thought of in this way: it’s nouns and verbs. The nouns are the things you get taught, that you can look up on Wikipedia, that you hear about on the news. Science is the process of acquiring knowledge. Knowledge is a noun. Science is a verb.

Consider a journey in your mind into the deepest levels of your body, to the nuclear heart of your cells where the secrets of life are hidden away. Today we know that in the nucleus of every one of your cells, we can find DNA — a long ladder of matched molecules (denoted A, C, G, and T). The order of those molecules along the billion-rung DNA ladder spell out the unique information needed to create and define every single living thing on Earth. But there was a time when we didn’t know that at all. The first people to know about the the delicate double helix of this master molecule were Rosalind Franklin and her graduate student Raymond Gosling, who in 1952 took the very first picture of the molecule by bombarding it with x-rays. Today that picture is known as “Photo 51,” and its role in the discovery of DNA’s structure is storied and fraught with all too human conflicts.

Photo 51, originally captured by Raymond Gosling and Rosalind Franklin in 1952. [Image: Wikimedia Commons]

Stare at that photo for a moment, the way scientists in the 1950’s did. Look carefully at the twist and weave, and see the rungs connecting the sides of the ladder. DNA is incomprehensibly smaller than your eye can see, but the picture captures its delicate form and spells out the previously unknown truth of how you and I and every lifeform on Earth are one with each other, siblings on the deepest levels.

Now lift your head up, and soar out to the enormously larger scale of the solar system. Voyager is NASA’s longest lived space mission, currently 45 years old and still pinging Earth with its lonely beacon as it sails beyond the Sun, farther from home than any object ever made by humans. But in early 1979 when it flew past Jupiter, it was young and in the prime of its life. It carried a suite of instruments to sense and record everything it could as it passed by the largest planet in the Sun’s family. Among the most precious things Voyager did was take pictures, and send them home to Earth like any good interstellar tourist might. Before Voyager even arrived at Jupiter, we knew about the “Great Red Spot.” It is a massive hurricane-like malestrom, twice the size of the planet Earth. It has been known to exists for the entire 400-years that humans have had telescopes and first pointed them at Jupiter; we have no idea how old it really is. 

Voyager I view of the Great Red Spot as it approached Jupiter in 1979. [Image: NASA/JPL]

But just look at the Great Red Spot, the way Voyager did. Observe it, study it. It is exquisite in form, in shape, in complexity, in color. It almost doesn’t look real. If you saw that picture hanging on my wall, you might think it was a painting, a creative outburst of some exquisite artist here on Earth. But it is indeed a painting, a massive and beautiful canvas of chaotic color made by Nature itself.

It is easy to get swept up in the nouns of science: knowing the exact genetic code for slime molds, the chemical structures of ant pheromones, the age of the oldest crocodile fossils, the distance to the farthest quasar, the diameter of the Great Red Spot, the number of teeth a great white shark has, or the temperature at the heart of the Kilauea Volcano. These are great things science has taught us. But they are not science in and of themselves. 

Science is the art of inventing ways to do the hard work of discovering. It may sound simple to figure out how many teeth a great white shark has, but it probably isn’t. It seems obvious perhaps that it is “hot” in the center of Kilauea, but I assure you no human has or could survive there. The how of getting all these bits of information, the experience of discovering, and expansion of our thinking about the world around us — that is science.

This is one of the hardest things about practicing science in the modern world: hanging on to the verbs, remembering the verbs, and giving them voice.

Science is a verb.

——————————————————-

This post is the second in a short series pondering what kinds of things make science difficult. The posts so far in this series are:

1: The Hardest Thing About Science – Language

2: The Hardest Thing About Science – Nouns & Verbs (this post)

The Hardest Thing About Science I: Language

by Shane L. Larson

One of the “features” of the modern world is memes percolating through our social media feeds, online browsing, and texts from friends. Sometimes these memes are humorous images, sometimes they are captures of tweets and posts, sometimes they are interesting facts. Let’s spend a few moments considering these last ones.

memecollection

Examples of common memes that relay information or observations about science [Images via your favorite local internet browser].

Memes that relay “interesting facts” are often tidbits of history, trivia, or scientific knowledge that are surprising or provocative. Many of these memes are absolutely correct, yet surprising, and they get rebroadcast over and over again.

mercury_hug

Why are such memes surprising and appealing? Sometimes they remind us of how little we know, or how it used to be when we were in school, or how silly complex questions can sound. They play with our deeply rooted notions of humor, playing word or pun games that juxtapose everyday language against the language of science. Chemistry memes are particularly good at this, where designations for the chemical elements — the 92 naturally occurring substances that the Universe creates everything from — are used to create words or funny turns of phrase. Like this meme about the element mercury, represented by its chemical symbol “Hg” (which comes from the Latin word for mercury, hydrargyrum — literally “liquid silver”).

sciencelogicmeme

Sometimes the reason is the propositions of science are used as beacons of stability in a world rife with randomness and illogic. Particularly in today’s world, where ideological arguments boiled down to soundbites are casually tossed around without much thought, people long for the ideals of impassioned debate moderated by reason and data. This is of course the standard that science aspires to, so memes promoting such ideals are popular.

But the memes of considerable interest are the ones that give you pause, and provide a delectable moment of cognitive dissonance. They challenge your thinking and world-view about something that seems ordinary, but apparently is not. 

Consider this very common repeated science factoid about the color magenta.

magentameme

If you are like most people, you may read this and go, “What? WTF does this mean? Of course magenta exists! Look at this shade of lipstick right here!

But to understand what is going on here, we have to dissect every little bit of the meme. First, of course “magenta” exists, because that square of color is clearly there, and recognizable in the array of colors people might call “magenta.” But the second part is the piece to consider carefully: it is a color your brain is using to interpolate between red and violet. This is where the science part of this factoid is. It has been presented to drive you into cognitive dissonance, but no effort has been made to really help you understand what it means in the concrete world of science… this is the failure of such memes.

It does, however, illustrate one of the hardest things about science: the imprecision of language. Human language, which we depend on every single day and use as a malleable all-purpose tool, cannot easily convey with precision and accuracy what science has to say about most phenomena in the world. Color is a classic example. What does a scientist mean if they make a pithy statement like “magenta does not exist”? They mean something very precise, but the language of our common vernacular means something quite different.

signequality-1

Consider the color in this image. What color do you name this? Show it around to family and friends and ask them what color they call it. You will get a wide range of answers: green, yellow-green, fluorescent green, fluorescent yellow, fire-engine green, safety-vest yellow. Well, what color is it? We all recognize this color, but there is no universal name for it, though using any of these names mentioned, and a few examples, would quickly firm up the color under discussion in conversation.

But that isn’t precise enough or good enough for science. Scientists need to know exactly what color is under discussion — perhaps they are trying to create an LED light to create that color, or making a sensor that responds only to that particular color when it is scanned. In this case, this color is very close to the dominant color of light shed by our parent star, the Sun — the reason we use this color for attention and safety is your eye has evolved over millions of years to be sensitive to this color.

sll_solarblackbody

The “blackbody spectrum” of the Sun. The hill-shaped curve shows how much light the Sun emits in each color, and it peaks in the “safety-vest yellow” range of colors (at a wavelength of 500 nanometers). [Image: S. Larson]

So what do scientists do, when language isn’t up to the task? We layer on a bit of mathematics. In the case of color, physicists use a number called wavelength (often denoted by a lower case Greek letter lambda: λ). In the classic rainbow spectrum of light, cast by raindrops or sun-catcher prisms, or bevels on your windows, every single color has a unique number that scientists use to identify it.

labeledspectrum

The approximate colors and associated wavelengths of light that are visible to the human eye (the “visible spectrum”). [Image: S. Larson]

In the communication of scientific ideas, this ability to clearly and unambiguously quantify something is critical. Consider the following two conversations about color:

Conversation 1:

    Father: I put your red jacket in the closet.
    Daughter: I don’t have a red jacket.
    Father: Yes you do, you wear it every day.
    Daughter: Pop! That is burgundy.
    Father: <blank stare>

Conversation 2:

    Astronomer 1: It was too red to show in the image.
    Astronomer 2: The camera should have picked it up. 
    Astronomer 1: The wavelength was around 720 nanometers.
    Astronomer 2: Oh, you mean really red.

As astronomers, we still depend on language just like everyone else, but we have a mechanism to fall back on more precise statements and specifications needed to understand the world around us. In the case of color, that is wavelength.

But what about the magenta? What does it mean that it “doesn’t exist”? It means that for a scientist, there is no quantifiable number — no wavelength — that identifies where in the spectrum of light the color you and I call “magenta” can be found. It cannot be found in the spectrum! Yet it clearly exists when you and I stare at this little colored square. It is, in fact, a mixture of pure colors from the spectrum — the violet and the red mentioned in the original meme.

In the rainbow spectrum, where each color has its own unique numeric label, if you take a bit the violet color, and mix it with a bit of the red color, and throw that light at your eye, your brain says “whoa! look at that magenta!” 

In many ways, the meme is being dishonest to get a shock out of you. The amount of violet and red to be mixed can be quantified to make different shades of magenta — otherwise printers and lipstick makers would have a much rougher time making things this color! There is an exact, quantifiable way to specify every shade of magenta you put on the table. 

Nature can make magenta, but Nature doesn’t make magenta as a fundamental building block.

saltcrystals_wikimedia-1

Salt crystals are not fundamental objects; salt itself is a combination of fundamental elements, sodium and chlorine. [Image: Wikimedia Commons]

It’s no different than elemental chemistry. “Salt” does not exist on the periodic table, but salt clearly exists in the same way magenta exists. In the fundamental, quantifiable world of the chemical elements (the building blocks of which everything on Earth is made), there are two uniquely identified substances: one is called sodium (Na) and one is called chlorine (Cl), and when I bond them together, I get something that is not elemental, but a mixture that we call NaCl — sodium chloride, or “salt.”

Saying something “doesn’t exist” has a multitude of interpretational meanings, but it means something very specific and very precise.  In the context we’ve been discussing here it doesn’t mean you can’t find something you and I would call “magenta” in the Cosmos — it means none of the fundamental building blocks of color, the rainbow of light, are called “magenta.”

This is one of the hardest things about science. Language is evocative and emotional and nuanced and, ultimately, imprecise. And since we are social creatures who in large part think in terms of language and act in response to language, it makes it hard — very hard! — for our brains to engage in the discovery of the world around us with the rational, quantifiable approach of science.

Moreover, it is hard to express personal enthusiasm and joy for the wisdom and knowledge that science has brought our species, when science itself is ideally more grounded — that dichotomy make the communication of science using this ratty tool we call “language” all the more difficult.

But we still try. With a few funny graphics and memes, a few stories and quips, and a few written words like these ones here…

——————————————————-

This post is the first in a short series pondering what kinds of things make science difficult. The posts in this series are:

1: The Hardest Thing About Science – Language (this post)

2: The Hardest Thing About Science – Nouns & Verbs


Everything’s Gonna Be Alright

by Shane L. Larson

The inimitable Mary Fahl has a remarkable song that I listen to all the time, especially on days when it seems impossible that the world has not totally fallen apart. It is a sonorous and passionate piece called “Everything’s Gonna Be Alright.” It opens:

Blind Willie Johnson in a capsule singing ‘bout the soul of man
Encoded traces of the human race and what we understand
A human choir out in the distance trav’ling by a satellite
Symphonic strains of our existence burned into a single byte
Mary Fahl performing “Everything’s Gonna Be Alright.”

For the uninitiated, Mary’s song may seem strange or obtuse — lyrical renderings of language that may have philosophical meaning if contemplated long enough, or may inspire deep visceral emotions if interpreted in certain ways, or simply seem to be pleasant nonsense in the way only songs and poetry can be.

But in reality, Mary’s song is a tribute, heartfelt and full of wonder, for one of our species’ most audacious and hopeful acts: the creation of a message that will far outlive our civilization, promising whoever hears it that we are sometimes better than we often are. The message was created, physically engraved in precious metals, and cast out into the wild voids of the Cosmos, never to be seen again.

That message is known as the Voyager Golden Record. Two copies of the record were minted from disks of copper plated in gold, shrouded beneath protective covers of aluminum, and mounted on the side of each of the two Voyager spacecraft. 

The Voyager Golden Record; the panel on the left shows the cover (inscribed with information to decode the record), and the panel on the right shows the record itself. [Images: NASA/JPL]

Launched 16 days apart in the autumn of 1977, the Voyager spacecraft were ostensibly part of humanity’s first reconnaissance of the solar system, sent to explore the giant worlds of the outer solar system — Jupiter, Saturn, Uranus, and Neptune. They swung by each world, dutifully snapping pictures and radioing their precious scientific data back to the distant rock from which they hailed. As they passed by each world, gravity latched on to them, propelling them ever faster and farther, on to their next destination.

Voyager flight paths through the solar system [Image: NASA/JPL]

Voyager 1 passed Saturn in November of 1980, and the Ringed Planet flung it up and out of the plane of the solar system, toward the constellation of Ophiuchus. In August of 1989, after a twelve year journey, Voyager 2 passed by Neptune, letting the icy giant’s gravity swing it down and out of the solar system, propelling it in the direction of the constellation Sagittarius. After fleeting and tantalizing glimpses of our cosmic neighborhood, the Voyagers have started the long, slow sail to the stars. Today they are the most distant physical artifacts of the human race, both of them more than 20 billion kilometers away, the Sun and Earth mere flecks of distant light.

Powered by small nuclear generators, the Voyagers’ energy is nearly spent. They will dutifully continue to transmit faint bleeps of information back to Earth, but within a decade or so they will fall silent and grow cold, hurtling ever onward toward the stars. Time, space dust, and cosmic radiation will take their toll on these artifacts of Earth, but the Golden Records were designed to stall such inevitable decay for as long as possible. Made of metals that are unreactive and change slowly over time, and encased behind protective aluminum covers, they should resist the long slow death, surviving for a billion years or more..

But what possibly could we have put on the Golden Records to warrant such care and concern about their survival? Mary Fahl told us up front:

Encoded traces of the human race and what we understand

Within the limitations of a physical object that could survive a billion year journey into deep space, we captured what we could about our species, the planet on which we live, the lifeforms we share the Earth with, and the meager understanding of the Cosmos we have gained. Together with greetings in many languages of the planet, and a selection of music from around the world, we engraved the information on 12-inch disks of gold covered copper, and sent them to the stars. It was a gesture of hope and optimism that, in some imagined future, an intelligent species somewhere across the empty sea of space might stumble across Voyager and be able to know something about who we were, faint echoes of a lonely planet and species that once dreamed of sailing to the stars.

Blind Willie Johnson [Image: Wikimedia Commons]

The key elements of the Voyager record are the protective cover, an included stylus (phonograph needle) to play the record, 115 images, a collection of the “sounds of Earth,” spoken greetings in 55 languages, and 90 minutes of music in 27 tracks. Blind Willie Johnson is the second to last track, singing  Dark Was The Night, Cold Was The Ground, a blues Gospel song, with no words but Johnson murmuring and humming along with his soulful guitar picking.

By today’s standards, the amount of data on the record is miniscule — a handful of images that are 512 x 384 resolution, and only 90 minutes of music. But that’s all there is, a small snapshot of life on Earth at the end of the 20th Century. It is likely one of the only artifacts of humanity that will survive our species; for some distant intelligence that might someday find Voyager, it is the only thing they will ever know of us.

The assumption we are making is that whomever might find Voyager will make an attempt to decode the Record. It’s an all together human assumption — if you found a bottle washed up on the seashore, a message carefully preserved inside, would you open the bottle to read it? Of course you would! In our optimism, we trust the receivers of our message will do the same.

On the surface, it seems to be an audacious thought, that a message encoded on a facsimile of a phonograph record could be received and decoded by an extraterrestrial who knows absolutely nothing about us, our technology, our species, our cultures, or our languages. But the message was designed with precisely that concern in mind. Astronomers call the idea of receiving such a message “communication without preamble,” and believe understanding it is predicated on a single fact: that the receiving civilization is technologically skilled.

The Voyager record cover provides protection, but also has information about how numbers are expressed (the “barbell” in the lower right is a hydrogen atom, whose properties should be known), instructions for how to play the record (the image of the stylus on the circle in the upper left), instructions for how to get data off the record (the information on the upper right, showing the data and the first image), and a map of where Voyager came from (the starburst on the lower left). [Image: NASA/JPL]

One of the great truths of the Universe, and perhaps the greatest mystery, is that everything is governed by an immutable set of rules that we call The Laws of Nature. The idea, the logical chain of reasoning, is that if you are capable of travelling into space to discover Voyager, it means you have a deep understanding of those self-same laws, enough so that you can harness them to travel the void of space yourselves. So we encoded the Voyager message using the common foundations of astronomy, physics, and mathematics that apply in every corner of the Cosmos, and trust that an understanding of those foundations will provide enough of a clue to decode Voyager’s precious cargo of sounds, music, and images. 

If you think deeply about this, you might argue that an alien species that recovers Voyager may not have eyes to see as we do, so images may not carry the same meaning. They may not have ears to hear as we do, so music may not be perceivable in the same way. But consider: there are many phenomena in Nature that our senses cannot perceive, yet our intellect and technology make us perfectly capable of detecting and understanding. If an extraterrestrial species is technologically capable, we think they will similarly be able to apply their intellect to understand the story Voyager has to tell.

How do you decide what to include in a message you are sending to the stars? What do you put in a time-capsule to represent our planet and ourselves to an audience we will never know? What do you send to a world and a biology and a history and an intellect completely alien to our own? What do you want beings a million years from now to know about us?

We could be cynical, we could be optimistic, we could be realistic, we could be practical. What should we be?

It is often pointed out that we could have included images and messages about our great failings. The wars we fight, the violence we inflict on one another, our great failings in justice and equity for all the citizens and life of the planet. We could have included images of atomic mushroom clouds, of dead school-children, of wasted and decimated landscapes destroyed by our short-sighted obsessions. But we didn’t do that. We took a very neutral stance, perhaps a sanitized vision of our world. We included pictures of our planet from space, of a tropical island, of a mother and child, of a farmer in Guatelmala, and 111 others. A cynical person might suggest we were being overly deceptive, and not showing the truly ruthless and sad character of our species. Perhaps, but I think not.

Just a few of the images included on the Voyager Golden Record. See a more complete list at NASA’s Golden Record Site. [Images: NASA/JPL]

No, flipping through the image library of the Voyager Golden Record one also gets the sense that this is not just who we are, but what we hope we are — a species that is living through the challenges of our own adolescence, a species that is for the moment surviving, and a species that aspires and believes that many thousands of years hence, our descendants will still be here, wiser and better off than we. We tried to choose a series of images that say we learned enough to build Voyager, and while we’re aware of the dangers we currently face, we are also aware that we are part of a much larger Cosmos.  Our meager collection of images and music is a realization of what we have learned, manifested in the optimistic act of constructing an impossibly limited message containing a few precious tidbits of life on Earth, from a species called “humans.”

And we tossed the message into the Cosmic Void, knowing not where the tides of space might take it.

There is absolutely no consequence if Voyager is never found, nor if the message is never decoded. There is a certain solace we gain from the mere notion that it might be found and might be decoded. Perhaps that solace is rooted in a deep fear — the fear that we are alone in the Cosmos, and everything that we are and think and do will someday perish, extinguished utterly from the Universe.

But I much rather like to think that the solace is rooted in optimism. We believe that it is worth shouting into the Void, shouting that we were here and this is who we were. We believe that, perhaps, there will be beings as intelligent and curious and emotional as we, and that they too might find joy in the discovery of Voyager. We imagine they might feel inexorably compelled to decode the carefully constructed message, and discover that they also are not alone in all the expanse of the Cosmos. We imagine that they too might be struggling through their own adolescence, hoping to not destroy themselves. We imagine that if they receive this small, meager message from Earth, the knowledge that they are not alone might help them somehow. We imagine that such a message might help us.

It is remarkable to think that the act of creating the Voyager Record is an act of optimism, and precisely what Mary Fahl’s lyrical exploration suggests to me. It suggests that despite all the challenges our species faces, despite all the clear failures that we foist upon ourselves, that some part of us still knows the remarkable things we can achieve, and we imagine the good that could result.

In days of gloom, in days of sadness, no matter what we do here on Earth, Voyager sails ever onward, its Golden Record cradled carefully on board, a message for a billion years from now. Perhaps, as Mary noted, “everything’s gonna be alright.”

Pandemic 03: Survivability Traits

by Shane L. Larson

Over the millions of years that natural selection produced modern humans, countless traits were selected becasue they were somehow advantageous to our suvival. Ultimately, some 40,000 generations ago, modern humans began walking the lands of Earth; experiments that Nature had made as it grew our branch of the Tree of Life were terminated without a second thought. Today, there are no archaic humans left — gone are those that came before us, erased but for a few fragments and bones that rise from the tomb of the Earth.

A skull of homo rhodesiensis, an ancient ancestor of humans. The Universe has long experimented with what makes humans good survivors; today there are no homo rhodesiensis left. [Wikimedia Commons]

One might ponder what it is about humans that made us the fittest in our long line of ancestors? The Latin name for our species gives a clue to what we think the advantage is: homo sapiens means “wise man.” More often than not, our intelligence, our brains, are regarded as the prominent trait that made our survival most likely. The ability to make tools, to solve problems, and to plan for possible futures are all powers of the brain that suggest its development was a good survival trait.

But for those of us who think about life in the Cosmos, we eventually ask whether or not human intelligence is a survival trait or not? Look at the utter disregard our species has for the finite resources on our planet, or the fact that we are willfully ignoring the accelerating climate crisis, or any of a hundred other existential global threats we are ignoring. It makes one question whether our intelligence is being used for survival at all.

Interestingly, the brain is just like every other physiological trait we have — it was built by Nature through a long chain of experiments in survival. The earliest parts of the human brain to develop, the paleomammalian cortex (or limbic system), is the core of human emotion and response to external stimuli, particularly danger or threats. It evolved over time, like all of your biological systems, to protect you and give you a better chance at survival. One of its safety responses is to control your psychological response to threats. Sometimes that response is designed to protect you from very tangible direct harm; at other times it is designed to protect you from very tangible threats, but ones which may harm you by overwhelming your reactions until you are completely debilitated.

We see both of these deeply ingrained threat responses playing out right now in the ongoing crises that have ensnared the world.

Death has always preoccupied humans, in biological imperatives, deep psychology, and art. This 17th Century painting from Philippe de Champaigne is often associated with the Stoic philosophies surrounding Memento Mori: “remember that you will die.” [Wikimedia Commons]

Consider how we humans perceive and deal with death. A single death can transform your worldview — the death of a close friend or a loved one has profound impact on your mental state, precisely because of the deep personal relationship you shared. Death acutely focuses your attention on the fact the memories you carry with you will be the last ones you have with that person. It also acutely focuses your attention on your own mortality.

But you don’t have to be personally related to a person, or even know them, to feel grief at the loss of life. You feel the same pain, as if it were a friend or a loved one, precisely because you understand the deep personal loss from the death of a single person. Your brain has been wired from your personal experiences to understand how single people change one another’s lives. You extrapolate those experiences to people you don’t know when you hear of their death. The result is you are devastated, tortured by grief when they die. The deaths of famous people are a curious mix of the two, since you often ascribe deep personal evolution to your exposure to music, writing, sports, and film.

As a result, the loss of David Bowie knocks you down, because you remember driving in your car with friends listening to “Scary Monsters” over and over again, and those powerful memories are inextricably melded with your knowledge of Bowie. Chadwick Boseman’s death sent you into a paroxysm of tears, not just because you admired him in 42, but because your own family has been ravaged by cancer. Your rage at the murder of Breonna Taylor was stoked by the fact that she was murdered in her own home, a place of perceived safety and sanctuary.

Tragically, our brains behave in the exact opposite way when the scale of the tragedy expands beyond numbers easily related to your own personal experiences. Word of a family dying in a car crash or an apartment fire invokes a terrible sense of tragedy. News of an airliner going down may fuel your fear of flying, but large groups of people being overwhelmed by disaster becomes, for the most part, abstract to your brain. The reason is your brain is defending itself in a rather peculiar way. You absolutely can imagine the tragedy of the deaths of thousands of people — but multiplying the agony of grief for a single person a thousand-fold would destroy your psychological balance, and your brain knows that. It clings to the abstractness of large, anonymous numbers, and lets your thoughts gloss over the fine-scale human details of the tragedy. This effect is called psychological numbing.

Map of confirmed COVID-19 infections per capita (total divided by local population) as of 17 Sept 2020. The global scale of this crisis is beyond normal, everyday human experience. [Wikimedia Commons]

Which brings us to the current crisis. Without fail, the coronavirus Pandemic is a global crisis, not to be shirked and ignored. It kills people — 948,000 worldwide, and 202,000 in the United States (as of today, 17 September 2020). For virtually everyone who contracts the disease, there are long term consequences that we are only now beginning to understand — cardiovascular damage, fatigue, deterioration of your joints, and damage to your nervous system. The dire effects are why scientists and public health experts are so adamant about controlling the spread of the disease.

But unless you or a family member or a close friend have had (or died) from COVID-19, your brain protects itself. The psychological numbing associated with the scale of the pandemic takes over, and underpins all your thinking, regulating your personal behaviour as well as guiding your response to widespread social safety measures designed to cap the disease. Numbing can dull your sense of danger, leading to you not being as safe as you can be. An unfortunate lack of perceived danger might convince you that everyone who is responding with great caution are being silly, and it could lead you to rebel against social safety measures like a teenager against curfew. Your brain is protecting itself by convincing you it isn’t as serious as it is, but it is lying to you. You can control such responses, but only through diligent practice and self-reflection, and fearless trust in what the scientific data is really saying, not what we want it to say.

And so, our conversation returns to where it began. The brain of homo sapiens, with its capacity for abstract thinking and predictive speculation is the product of millions of years of evolution. Each stage in the long chain of natural selection helped our ancestors survive a ruthless and dangerous world, leading to us today.

So are our brains a trait that makes us fit for survival? The Universe developed our brains because along the way it seemed to be protective. But psychological numbing exposes us to threats that can decimate our species, like coronavirus to be sure, but other existential threats are on the horizon: pressures of population on limited natural resources, human wasting of natural environments, and the catastrophic collapse of the climate at the hands of humans. 

One could easily conclude that on the scale of our civilization, psychological numbing is not a survival trait, and the great experiment known as “humanity” will terminate, and fade into oblivion. It has happened before, with megalodons, sabre-tooth tigers, and trilobytes. That termination has happened to humans too — gone are our ancestors, Australopithecus, homo erectus, and the Neanderthals. But it has happened to our civilizations before too — gone are the ancient cultures of the Indus Valley civilization and Mesopotamia, and only fragments of the ancient Anasazi remain in the American Southwest, all erased by droughts that destroyed their supportive, agricultural systems. Humans are not immune to being erased by the Universe.

The Tree of Life is vast and tangled, but many more species have died than have lived, unable to survive the challenges the Universe throws at them. [Image: Pixbay]

But on the other hand the Universe has stirred another ability into the experiment — our capacity for reason, the ability to look at the Universe, figure out and predict what is happening and why, and doing something to protect ourselves. In some fashion, we have learned to utilize that trait and act in complete contraction to other biological imperatives our brain would like us to respond to. The Universe is testing out the idea that software updates, designed to circumvent hardware weaknesses and previous programming, might be a good survival trait.

Whether or not our reason adds to our survivability in the long term remains to be seen. We have yet to come to the end of this crisis, and do not yet know if our civilization can collectively shore up our defenses, or if we will continue to capitulate our future on the basis of wishful thinking. 

Either way, the Universe does not care. The Universe is callous, ruthless, unflinching. It is no mere tyrant, it simply has no reservations about terminating experiments that cannot survive in the face of adversity. Perhaps homo sapiens will sink into extinction; perhaps there will be some new strain of humans, homo postero, that will not be so fact resistant, and can survive more adversity than we.

As a brilliant fictional scientist once observed, “Life finds a way.” The Universe will find a strain of humans fit for survival, even if we are not.

————————-

This is the third in a series of posts about scientific reasoning, instigated by the Pandemic of 2020. The first post and links to the rest of the posts in this series are:

Pandemic 02: Numeracy and Data

by Shane L. Larson

Let’s talk about “numeracy” — to be clear, I define this to be the ability to use and understand numbers and data. It is similar to “literacy” but related to quantifiable things, things that can be measured, and things that obey well defined and incontrovertible rules. Specifically, I want to talk about your numeracy.

I have spoken with many thousands of you at public lectures, and many more thousands of you have sat through my introductory physics and astronomy classes. I certainly hope there are many more thousands of you reading this. At this moment, my former students have a certain advantage over all of you — they know better than to utter the words “I’m not good at math,” lest I get out an actual soapbox (I’m quite short), stand up on it, and wax on and on about how that simple phrase, “I’m not good at math” is a lie you have been taught to repeat. You might call such a soapbox speech a “rant,” or so my teenage daughter tells me (she also knows to never utter the words “I’m not good at math”).

Many people like to opine that they are “bad at math” because they struggled at one point in the past, or because someone told them they were, or because it is cool to say you are “bad at math.” In fact, most of you aren’t bad at math at all — you just aren’t practiced at recognizing that fact.

I can already hear your objections. I know you will insist that you are bad at math based on a poor past experience in a calculus class, or the fact that you struggled with solving cubic equations, or because you don’t have a foggy clue what tensors are. Fair enough. But I don’t remember any of the soliloquies Shakespeare wrote in Hamlet; I can’t diagram a sentence, nor do I precisely remember the definition of a transitive verb, and I suspect the only reason I know about conjunctions is from singing Schoolhouse Rock songs. But I would not deem myself “bad at English” or “illiterate” as a result (my former English teachers might disagree; sorry Billie Wright!).

But this is precisely my point about math. You are not “innumerate” and “bad at math” — there are sophisticated and complex advanced topics you may have been taught at one point in your life and perhaps didn’t fully grasp and may not remember today. They were taught to you in order to develop the neural and cognitive framework of your brain, just like you were taught about diagramming sentences and iambic pentameter. Today, decades after you were last in a classroom, you may not remember all the details but you still have that cognitive framework. You are perfectly capable of using it. You are “numerate” and I know you are because I see you be numerate every day.

You very seldom fail to order the correct amount of pizza. Calculating incorrectly in either direction can be disastrous; you are numerate enough to do this.

For example, suppose your book club is going to meet next Saturday and you need to order pizza. What do you do? You count up how many people are coming, you estimate how many pieces of pizza each person will eat (based on prior observations), you add a few extra pieces in that your partner and kids will take, and based on the number of slices in a pizza, you place an order. You pretty much get it right every time. Seldom have you ordered 78 pizzas for 7 people because you are “bad at math.”

What if you are trekking across the country on your National Parks road trip. Your dependable late 90’s economy car gets maybe 28 miles per gallon, you’ve got 3/4 of a tank and are heading out onto the long stretch of I-90 between Sioux Falls and Rapid City and quickly calculate when to stop for gas so you don’t run out. You pretty much get it right every time and have seldom been stranded out in the middle of South Dakota.

You regularly and successfully calculate how much gas you need to make long trips. You are numerate enough that you have seldom, if ever, run out of gas in the middle of South Dakota.

You are perfectly capable of assimilating data (data are things like previously knowing how many pizzas are eaten or how far you drive on a tank of gas) and using current conditions (things like how many people are coming to your club meeting, or how much gas is left in your tank) to make a numerical calculation (how many pizzas to get or how much gas to buy). You are fine at math. More to the point, you are numerate. You don’t think about it, of course, because the risk associated with over-ordering pizza is low; you seldom have to make a 400 mile run in your car without hope of seeing another gas station soon. It doesn’t change my point that you are, in fact, numerate.

The value of being numerate cannot be overstated in the face of the crisis the world faces today. Understanding what COVID-19 numbers are telling you, and perhaps more importantly what they imply about your personal risk, is critical to safely weathering the Pandemic so you can emerge on the other side. In the sea of numbers we hear each day, how do we absorb those numbers and use them?

Numbers have a certain implacable relentlessness to them, a modicum of unassailable truth that is regularly at odds with the distinctly human need to rationalize.  That being said, a number’s implication for how it impacts your life requires context, otherwise it’s just a number devoid of how it relates to the world. We can use your numeracy to illustrate how context is important, and then apply it to understanding the current crisis.

Let’s begin with a learning experiment — a simple example that illustrates how information combines together to inform you about the world. Imagine I have a carpeted living room with a nice square grid pattern in the carpet, 20 squares by 20 squares (400 squares total). For some extravagant reason beyond the scope of this blog post, imagine I have dropped some nickels on the carpet; a lot of nickels. You are enjoying your lunch, and trying to decide if it is worth interrupting your delicious sandwich to go pick up all the nickels before someone else does. So you send me in to check the situation out.

An experiment in dropping nickels on a carpet. Each square of carpet is the same size, and the same number of nickels were dropped each time. What is shown is what landed and stayed in each square.

CASE A: I come back with two nickels. Do you go pick up nickels or not? Without any context you really can’t decide. Unhappy with me, you send me back into the room and I come back with five more nickels! Now you have a total of seven nickels, or 35 cents! Do you go pick up the nickels or not? This is all about context of the data — what do the nickels I brought back to you represent? Did I bring you all the nickels, or just a fraction of the nickels? How many more nickels might there be? 

CASE B: This time when I come back, I bring you 7 nickels, but I tell you they were all the nickels in one square of carpet.  This is context. Context allows you to start figuring things out, because you are numerate. In particular, if every square has 7 nickels on it, and the room is 20 by 20 squares (400 total squares), then the room would have 400 x 7 = 2800 nickels, or $140! This is good context, but we could still do better.

CASE C: In the last example, you made an assumption. Assumptions are neither good nor bad — assumptions are limited. The important thing about assumptions is that when you make them, you try to be clear about what the assumption is, so if your understanding of the situation improves (you get more data), you know how to update what you think is going on. Above, you assumed every square had 7 nickels. Is that true? You send me back into to find out.  I come back and tell you I looked at three more squares, and they had 23, 18, and 20 nickels in them respectively. This is greatly improved context, because you have many pieces of data. There are simple and complex ways of looking at data, even when you have only a few bits of information. One of the easiest is the average.  What is the average number of nickels on a square?  Based on our observed data:

   Average = (7 + 18 + 20 + 23)/4 = 17 nickels per square (on average)

So now you can estimate that in the room there would be 400 x 17 = 6800 nickels, or $340 dollars! It is definitely looking like you should be collecting those nickels.

A simulation dropping 8000 nickels on a carpet that is 20 x 20 squares wide. Note the highlighted random square — this one has 7 nickels, the first square we talked about in our discussion. [Image: S. Larson]

This image above shows the data this example was drawn from — a 20 x 20 carpet grid, with 8000 nickels ($400) dropped on it.  The first experiment where I brought you only 7 nickels told you something, but by collecting more data you developed a clearer picture of what was going on in the living room.

Now let’s use this example to help us understand something about the Pandemic.

As the coronavirus Pandemic has surged in the United States, considerable noise has arisen around testing and what the number of tests and results mean. Fortunately, you can use your numeracy to understand what the data is telling you. Two common testing numbers are reported for most states: 

  • The number of tests administered
  • The number of new daily cases (number of positive tests)

In and of themselves, these numbers have no context, except that most of us have some rudimentary knowledge of our state to provide context — the critical knowledge here is the population. Population provides a simple way to understand how widespread the disease is: 500 cases in a county with 20,000 residents has different implications than 500 cases in a state with 1 million residents.

One of the most common points of discussion in COVID-19 testing is whether or not the number of cases is rising just because we are testing more. At the heart of this talking point is the more fundamental question, the question we really want to know the answer to: how do we know if the coronavirus is spreading and growing in our state or not?

Testing is just like our nickel example above, and you can use the nickel example to help guide you in your thinking. 

NICKELS: Each square has some random number of nickels in it. If I look at one square, I get some sense of how many nickels there might be. If I randomly look at many different squares, I get a better, more reliable picture of how many nickels there are in the entire area of the carpet. If I get 7, then 23, then 18, then 20 nickels, there are on average (7 + 18 + 20 + 23)/4 = 17 nickels per square.

COVID-19: Take a fixed number of people, say 100. If I test those 100 people, I get some sense of how many COVID-19 infections there might be. If I randomly pick many different groups of people, I get a better, more reliable picture of how many COVID-19 infections there might be. If I get 7, then 23, then 18, then 20 infections, there are on average (7 + 18 + 20 + 23)/4 = 17 infections per 100 people.

Reporting the number of infections together with the number of tests given is called  the positivity (or, more correctly, the positivity rate), and is a way of giving context to the data. Another way to give context is to report the total number of cases divided by the population (typically reported per 100,000 people, rather than the full population; this is more similar in size to a typical community and helps personal visualization about how widespread COVID-19 might be in a small city. Cases per 100,000 also is easier to talk about without making arithmetic errors!). Most state health departments and most major COVID-19 tracking sites that report daily data report both of these important numbers, giving you a better way to understand the risk.

So how do you tell if things are improving, holding steady, or getting worse? You watch how a number like the positivity changes over time. The number of known cases does increase with time. The number of known cases does increase with the amount of testing deployed. But the positivity rate accounts for that fact by always thinking about the data in fixed, similar sized chunks. In our examples above, deploying more tests means more groups of 100 tests to include in the average. Just like counting more squares on the carpet gives a better idea of the number of nickels, increasing the number of tests improves how well we know the positivity rate, which more accurately captures how COVID-19 is spreading in our communities. So the rule of thumb is:

  • If the positivity rate is increasing, then for any random group of people you pick, more of them are sick with COVID-19
  • If the positivity rate is holding steady, then for any random group of people you pick, the disease is not increasing rapidly
  • If the positivity rate is decreasing, then for any random group of people you pick, the disease is slowly being eradicated

You could also replace “positivity rate” in these rules of thumb with “cases per 100,000” if that is an easier number for you to relate to. The story the data is telling you will be the same either way.

Now keeping all of this in your head can be hard, even for those of us who “do numbers” every day. Use your mental examples, like the nickels on the carpet, to keep you grounded. Tactile, hands on examples that you could actually recreate on your living room floor are often easier for your brain to work with, since they are easily visualized or even created, making it easier to stick in your mind.

We will come back to using simple mental models to keep our reasoning grounded in some more of our upcoming discussions. Until then, be safe, be well.

————————-

This is the second in a series of posts about scientific reasoning, instigated by the Global Pandemic of 2020. The first post and links to the rest of the posts in this series are:

Pandemic 01: Learning in a Time of Crisis

by Shane L. Larson

For many of us, we have not been under the tutelage or mentoring of someone in in a learning environment for a long time. Classrooms were a regular part of our lives years if not decades in our past. Once we left classrooms behind us we did not quit learning, we just changed what we learned, and we totally changed the balance of what we learned. 

Nowadays, you learn on the fly and on your own. Maybe you were tutored in your current job skills during your first week at your company. You’ve probably done a lot of learning by trial and error (especially on home projects, like building decks, learning to garden, or sponge painting a wall so it looks good). Maybe you learned through a lot of hard knocks, starting your own business and figuring out how manage employees, price products effectively, and manage supply chains. And perhaps you still learn by surfing the web when your curiosity gets the better of you and you want to know what the life-cycle of catfish are, or how they built the Grand Buddha at Leshan, or who invented waffles anyhow? You never stopped learning, you just stopped going to school.

But there is a simple fact here: you are plenty smart, and plenty capable of taking unfamiliar information, assimilating it, and working with it. Your everyday learning life says that very clearly, and it works great for most things, especially if they are low risk, meaning they don’t threaten life and limb. Small errors can be corrected, methods and skills can be practiced without terrible consequence. But what do you do when things get really complicated?

The global pandemic caused by the coronavirus outbreak has flooded all of our lives with new information. Daily infusions of numerical data, graphs, predictions, extrapolations, models, parameters, error bars, data quality factors, trendlines. If you don’t think about data and numbers and scientific implications every day, it’s all a bit overwhelming and has a tendency to exacerbate uncertainty that abounds with a crisis that is fast moving and constantly shifting as dew data and findings come to light.

My fellow scientists and I encounter this kind of data, and in particular this kind of data onslaught, every single day. We’ve spent our entire careers reading graphs, looking at numerical data, building predictions from that data, and assessing implications and possibilities.

But if you aren’t a scientist, how do you dip your hand into the COVID-19 firehose and gather enough information to help you feel informed, enough information to perhaps quell some of the anxiety you may feel, and most importantly make an assessment of risk to help yourself plan accordingly?

Some of you are lucky enough to know a scientist or medical professional, and you may have reached out to them to ask a question or two, dipping your toe back into that learning environment you left behind in classrooms long ago. For those who know me and have had the courage to ask, I have fielded many such inquiries, answering questions about how to understand data and the implications of data and predictions to the best of my ability.

The answers to those questions aren’t always clear, because for many aspects of this crisis we are simply still ignorant. For many other aspects of this crisis, we understand in crystal clear terms what is going on, but uncertainty hinges on the fact that what is to come is largely dependent on what we do now. Understanding that our knowledge about COVID-19 and the coronavirus is evolving is just as important a lesson as being able to read a graph or understand a trendline. Understanding there are incontrovertible uncertainties, and what it means for personal risk, is essential. Understanding that there are actionable things we can do to minimize risk is absolutely critical. All of these lessons are there, in the firehose of data.

So for the next few posts, I’m going to spend some time doing what I do — trying not just to answer some of the questions I’ve been asked, but also trying to remind you of the skills someone once taught you long ago in a science class. Back then, you might have asked why you need to know all this science stuff. THIS. This is why. Because sometimes life in the modern world requires you to think a bit like I think and look at graphs and data.

These posts will feel a bit like your old science class did, and some of you remember that you didn’t enjoy that class. I get that. But at this stage in my career, I have taught introductory science to thousands of students, and I’ve talked to thousands of you on the public talk circuit. In all of those  experiences, I have discovered a secret:

You can understand this, better than that little voice in the back of your head gives you credit for when it says “I hated science!

I know, because I’ve talked to you. So let’s talk about the Global Pandemic, and the COVID-19 crisis for a few posts. Your life, and the life of your friends and family depends on it.

— — — — — — — — — — — — — — — —

This is the first in a series of posts about scientific reasoning, instigated by the Global Pandemic of 2020. The links to the rest of the posts in this series are:

The Work to Be Done

Note to my Readers: The last time I posted, we were discussing Antarctica; I have more to say about that, and it is not disconnected from issues surrounding human activity on this planet, but current events have overtaken us, and that discussion will pause for a time, allowing us to focus on the convulsions our society is facing in light of global responses to the coronavirus pandemic, and now the long-overdue rebellion against the injustices visited upon people of color around world. It is of the latter that we will speak today. – s

========================================

As the current upheaval embraces our society, sparked by centuries of racial injustices in our country, I have heard scientific colleagues express quietly they are uncomfortable. Their quiet mumblings take the usual form of “I just want to be able to do my work.”

There is undeniable resistance to participating in the calls for racial justice, to demanding that we begin to tear down the structural support of all the systems that enable and prop up racial injustice. Such resistance is born from an indelible recognition that we, white people and mostly males, have benefited from and enjoy the protections of those systems. In science in particular, indignation in the face of worldwide protests and disruption of “normal life” is born of an intense understanding that no matter what we do or have done to combat the ills of our society, no matter how aware we claim to be, each of us is a paragon of privilege, embedded in a system that has favored us, unaccountably in contradiction of our stated ideal of “merit alone.”

I hear repeatedly, “but this is politics; I want to work on science, not participate in politics.” This is NOT politics; the label “politics” is a shield we hide behind to avoid conflict. This is precisely our work as scholars, and in particular as scientists. The fundamental purpose of teaching and practicing science is three-fold:

  1. To objectively solve problems using data and evidence based reasoning;
  2. To build human knowledge;
  3. To use that knowledge to improve and enrich our lives

All scholarship, but science in particular, thrives from having many minds together. Science advances through a diversity of voices and minds, a diversity of experiences and worldviews, a diversity of thought and approach. In spite of our proclaimed ideals of dispassionate logic and evidence based thinking, we as a profession have eschewed and avoided that diversity, and are less than we imagine ourselves to be as a result. Like the rest of society, we have marginalized our fellow humans who have aspired to participate in the most unique and valuable of human endeavours, the seeking of knowledge which serves no other purpose but to improve and enrich our lives.

We are well accustomed to data and careful scholarly research, and claim to have an unswerving respect for facts no matter what cherished beliefs they challenge. The data tell a sad and malevolent story of our failure to engage and support people of color in the scholarly enterprise. We have an undeniable bias against people of color. Witness: Despite making up nearly 13.5% of the US population, Black Americans only make up 6% of the professoriate; Latinx and brown Americans make up 18.3% of the US population, but only %5 of the professoriate (Pew Research link). Our chosen metric of success, particularly in the sciences, is citations of published work, a supposed mark of scholarly awareness of your contributions. Scholars of color are severely and uniformly undercited (Journal of Communication, 68, 254 [2018]). Studies of racial representation at scientific conferences is nascent, but conference talks and panels are still dominated by white males (Nature 573, 184 [2019]).

These findings are all based on research and data; their implications are uncomfortable to contemplate but clear in their message: there is tremendous work to be done. The protests around us are, in part, about exactly this work — the structural inequities built into our system that prevent people of color from engaging in the same work as you and I. The protests around us are, in part, precisely about the fact that we have ignored this for decades, or at best, ineffectually addressed this for decades.

My white colleagues may be reading this right now and saying, “but I’m already doing my part.” It is time to do more. Whatever you’ve done before was good, but the work is not over. The work is never over, and you know that, otherwise you would not recognize that you’ve attempted to improve racial justice in our society.

There are many many suggestions for what you can do as a white citizen to help break down the structural inequities in the country; I will not repeat them here (nor could I possibly link to all of them — I’m personally starting with suggestions from Perri Irmer, President and CEO of the DuSable Museum of African American History in Chicago). But as scholars and members of the university community, there is plenty you can do beyond your own personal education — just look at the data I linked to above, then take it to heart.

Work to improve the representation of people of color in university faculty; ensure that your citation practices do not exclude scholars of color; and do not allow your professional societies or colleagues to host conferences with exclusive speaker line-ups or panels of white males.

This is the beginning of the work to be done. Within your departments do not let unjust language be used without penalty; do not let people of color be silenced in departmental debates and conversations; do not let their work and contributions go unnoticed or be claimed by someone else; promote them as you would promote yourself or students who work with you.

It’s time to speak up and use the positions the system has put you in. You may be uncomfortable, but this is the work to be done, and you are the only one who can do it. It’s no different than what you tell your students: you aren’t being graded for how hard you work, you’re getting graded for what you accomplish. There is no extra credit, just the work you have to do.

Antarctica 02: Every Time You Turn Around

by Shane L. Larson

[Photo: M. B. Larson]

We are homeward bound from Antarctica, back in the travel pipeline, back in the bustle of everyday human life.

As the sights, and sounds, and silence, and color, and light filter around my mind’s eye, I begin to contemplate what to tell people who ask me about the journey I am now concluding.

How was it? What was it like? What did you see? What was your favorite thing? How do you feel?

I suspect there is no adequate way to capture true and authentic answers to any of those questions. Antarctica is a vast, ethereal place, unlike any other on the planet. Pictures and movies will never capture the expanse, the majesty, the grandeur, the mind- and spirit-altering experience of literally every moment you spend there.

Antarctica is unique, and would fail to move only the most brittle and wretched of spirits. I was there, immersed in only one small corner of a BIG place for only five days. In such a short time, I did everything I could to let the experience in and penetrate as deeply as possible. It is a transformative encounter. Every single moment you turn around there isn’t just more, there is new, there is heart-stoppingly different, there is something Antarctica is saying that no-where else on Earth can. 

You try to capture it through a camera lens.

You give up and just stare.

You try to describe it with the best words you have.

You give up, and just shrug, nodding knowingly at the person next to you who also failed to find adequate words.

You try with all your might to describe Antarctica, and its just not… enough. It’s not enough to use something as simple as words, or as inadequate as pictures. It makes you deeply contemplative, especially when you are immersed in it, and those contemplations beg to be expressed, however jumbled they may be when given voice.

But I will try. I have to try. Because Antarctica blew me away.

Every time I turned around.

[Photo: S. Larson]

The first day we were there, everyone would ask, “How are you doing?” And I would say, “I can’t stop smiling!” That was true. But then I’d look out a window, or turn around on deck, or be struck by the silence. I’d encounter Antarctica anew, different than just moments before, and it overwhelms me. It just spills out, bursts out more than just a smile, more than joy and fun and laughter. A deep pleasure of the spirit, a profound awe at the grandeur of this planet, a shift in the center you never knew you had. 

I think the best word to describe how I felt is “ebullient.” It was — it is — just wrong to contain such a swell of joy and not let it out.

Of course, the most frustrating thing about this is I want to be able to say and show something about the voyage that  somehow adequately captures this. I want to capture it and remember everything.

But I can’t photograph everything.

I can’t capture every detail.

I can’t describe it all.

I can’t remember it all.

Because Antarctica simply blows you away.

Every single time you turn around.

So I did what I could to capture, to record, to write what I saw and felt there. For the next few posts I’ll try to share some of that here. To inspire you, to give you a taste of what it was like. But mostly, I think, to remember.

It will be enough. It has to be enough. Because Antarctica deserves for me to try. It gave me everything I asked for. And because should I be so lucky to return, Antarctica will start all over with me again, like a clean slate, teaching me something new.

Every single time I turn around.

[Photo: M. B. Larson]

——————————————————-

This post is the first in a short series to document a journey I made to Antarctica with Lindblad Expeditions and National Geographic in the late days of January 2020. The other posts in this series are:

Antarctica 01: Daydreams

Antarctica 02: Every Time You Turn Around (this post)