Tag Archives: SP@H

Humanhenge — Marking Time in the Modern World

by Shane L. Larson

The other morning, when she was trying to decide what to wear for the day, my daughter said to me, “Is it cold outside?” Then, without missing a beat, she says “Never mind,” and picked up an iPhone and checked the current weather conditions. This brought to mind a vivid memory from my childhood of me asking the same question of my mother, and her saying “Go out and check!”  She had a rock on her porch; if it was wet it was raining, if it was white it was snowing, if it was hard to see it was foggy, and so on.

Far be it from me to eschew modern technology; it can do awesome things!  But it strikes me that if there is any truth about modern society, it is that it is entirely possible to live your life looking through the electronic portal of digital technology, rather than by looking out the window.

My schedule is kept by a modern calendar application, accessible from my phone. This is modern progress. Sigh.

My schedule is kept by a modern calendar application, accessible from my phone. This is modern progress. Sigh.

This was not always the case, of course.  Our forebears had to pay attention to the world, literally because it was a matter of life and death. Today, if strawberries are out of season in the northern US, no worries — your local store is shipping you some from far away, the cogs of the modern economy meeting your every whim.  But hundreds and thousands of years ago, crops had to be planted in time for the life giving rains, and harvest had to be brought in before fall frosts destroyed the yields that had to last through the winter.  Before quartz watches, before Greenwich Mean Time, and before Google Calendar, people still had to know what time of year it was.

So what did people do before the world worked on linked times and calendars? They watched the sky! The sky is filled with a regular clockwork of motions that ticks off the seconds, days, and aeons as precisely and regularly as the finest timepiece humans have ever made. The motions in the sky are a combination of the Earth’s orbital motion around the Sun, the spin of the Earth on its axis, and the fact that the North Pole of the Earth is not pointing straight up from the orbit.

One observational consequence of these three facts is that the Sun’s position in the sky changes over the course of a year. Each day it rises and sets at a different point on the horizon, and it tracks across the sky along a different pathway.  The equinoxes are the days during the year when the Sun rises and sets directly in the East and West. The solstices are the days during the year when the Sun rises and sets at the point furthest North and South on the horizon.

The ever-changing rise and set position of the Sun along the horizon can be used as a calendar. One of the most famous examples is the Shungopavi horizon calendar of the Hopi in the American southwest, shown below.  As the sunrise marches north and south along the horizon, its passage by certain landmarks indicates times of planting, harvest, and cultural ceremonies.  While you likely have no need for a horizon calendar, it can be fun to construct one via sunrise observations at your own home, like mine in Paradise, Utah, also shown below.

Example horizon calendars. The Hopi Shungopavi horizon calendar (top), and my personal horizon calendar for Paradise, Utah (bottom).

Example horizon calendars. The Hopi Shungopavi horizon calendar (top), and my personal horizon calendar for Paradise, Utah (bottom).

There are many ancient sites around the world where the rising and setting of the stars and Sun are aligned over carefully placed stones and architectural structures.  Stonehenge on the verdant Salisbury Plain, and the great Anasazi kiva Casa Rinconada in Chaco Canyon, and the Great Medicine Wheel on top of Wyoming’s Bighorn Range.  All of these sites, and many more besides, bespeak of the intimate knowledge our ancient ancestors had about the sky.

Ancient astronomically aligned sites. (L) Stonehenge, (C) Casa Rinconada, (R) Bighorn Medicine Wheel.

Ancient astronomically aligned sites. (L) Stonehenge, (C) Casa Rinconada, (R) Bighorn Medicine Wheel.

Manhattanhenge, looking down 42nd Street.

Manhattanhenge, looking down 42nd Street.

Sometimes modern landscapes align with the celestial clockwork, possibly by design but often by accident.  Consider the island of Manhattan. The island sits in the mouth of the Hudson River, canted diagonally to the north-south direction.  When it was first settled, the streets were laid out willy-nilly, in the usual haphazard organic way of ancient cities.  The expanding maze of twisty little streets that all look the same was abruptly ended by the Commissioners’ Plan of 1811, which established a grid plan for the growth of the city.  The grid was laid out with the long northish-southish thoroughfares running parallel to the coastline of the island.  As a consequence, the cross-streets running eastish-westish are all canted roughly 25 to 30 degrees to the east-west direction.  As it turns out, that is just the right tip for all the streets to be close to lining up with the sunrise and sunset directions on the Summer Solstice!  This was famously noted about ten years ago by Neil deGrasse Tyson, who dubbed the phenomenon “Manhattanhenge.”

The street grids for Manhattan (L) and for Chicago (R). The geometry of the streets determines when you will have a well placed sunrise or sunset to make a cityhenge.

But you don’t have to travel all the way to Manhattan to enjoy modern astronomical alignments.  Many towns and cities are laid out on a grid system.  For grids lined up on a north-south and east-west system, magic happens every March and every September, on the equinoxes.  For instance, in the city of Chicago, the streets are laid out (more or less) on a rectangular grid aligned to the compass points, and a “Chicagohenge” can be photographed on the Spring Equinox in March, and on the Fall Equinox in September!

Examples of Chicagohenge [Images from Ken Ilio's Uncommon Photographers].

Examples of Chicagohenge [Images from Ken Ilio’s Uncommon Photographers].

No matter where you are, there is probably an opportunity to use your city as a henge for photographing the ever-changing motion of the Sun.  Even small towns, like Vankleek Hill, Ontario.  The town is about half-way between Ottawa and Montreal, and has a population of only about 2000 people. The grid is laid out canted to the compass points, roughly parallel to the drainage from Lake Ontario into the Gulf of Saint Lawrence.  It’s just enough to line up with the Sun on the solstices, captured in this image by Gabriel Landriault.

(L) The street grid in Vankleek Hill, Ontario is canted about 20 degrees to an east-west line. (R) A summer solstice along Vankleek Hill's streets [image by Gabriel Landriault].

(L) The street grid in Vankleek Hill, Ontario is canted about 20 degrees to an east-west line. (R) A summer solstice along Vankleek Hill’s streets [image by Gabriel Landriault].

The Vankleek Hill picture hints at another point in this whole game.  The streets in Vankleek Hill are only canted 20 degrees or so from east-west, whereas the Sun is a bit farther north on the solstice, so is not perfectly aligned in this case.  But there is some day during the year when it is aligned!  This is a subtlety that was hinted at by our horizon calendars — the Sun is always on the move, marching up and down the horizon.  On the soltices and the equinoxes it is in a definite, predictable location on the horizon.  But with some careful planning, observations, and simulation (such as with a planetarium simulator like Stellarium), you can figure out when the sunrise and sunset will line up with the streets in your own town.

An example simulation of sunrise and sunset from the Adler Planetarium on the Spring Equniox, using StarryNight desktop planetarium software.

An example simulation of sunrise and sunset from the Adler Planetarium on the Spring Equniox, using StarryNight desktop planetarium software.

The truth is, it is not a life and death matter if I don’t pay attention to the daily motion of the Sun and use that information to lead a subsistence, agrarian lifestyle.  I have a calendar, the Farmer’s Almanac, and Google to tell me when to plant my snap peas.  I can really just do astronomy for fun — because it is cool, and it lets me capture some beautiful pictures that I can use to impress my friends and woo members of the opposite sex.

The Spring Equinox is just around the corner!  So go out with your cell phone and catch a sunrise or a sunset, directly down your nearest East-West street. Make sure you tweet the picture to the rest of us, so we know it is spring and can start to think about planting our gardens; strawberry season is on its way!

Rocket Science in my Pocket

by Shane L. Larson

When I was growing up, the end-all toy of toys was a Remco utility belt.  In accordance with my secret personas and the innermost inscrutable desires of my soul, I had two: a Batman utility belt, and a Star Trek utility belt.

(L, upper) A Remco Batman Utility Belt. (L, lower) A Remco Star Trek Utility Belt. (R) A modern tricorder toy.

(L, upper) A Remco Batman Utility Belt. (L, lower) A Remco Star Trek Utility Belt. (R) A modern tricorder toy.

I’ve always been a Trekker at heart, so the Star Trek utility belt was my favorite, mostly for the tricorder.  Today, I have replicas of all the classic elements of this old Remco belt — phaser, communicator, and tricorder — but the tricorder is still my favorite.  I love the tricorder because it is a small device, easily carried, connected to all the knowledge of the world, and able to probe the world around you with a suite of sensors and gizmos — a tricorder can do anything. At the time Star Trek was created, and even up through the most recent Star Trek series on television, tricorders were science fiction.

My iPhone 4S --- a modern day tricorder.

My iPhone 4S — a modern day tricorder.

But tricorders are no longer science fiction.  There is an X-Prize competition to make a working medical tricorder a reality. More importantly, many of us are walking around with tricorders in our pockets right at this very moment (are you reading this blog on one?); we call them smartphones. Smartphones are awesome devices. They are smaller than the tricorders of Star Trek, but they have built into them the capabilities of communicators, and they can connect to the worldwide digital library of human knowledge that we call “the Internet.” Most importantly they are outfitted with a suite of physical sensors that can be used to understand the world: a camera, a light sensor, microphones, a magnetometer, and an accelerometer.

It may be easy to ignore these little gadgets, dismiss the sensor suite as features (toys) for complete uber-nerds.  The data they produce may seem somewhat esoteric, and obtuse, far removed from the things you care about in everyday life. But these sensors provide you — an average citizen of the Cosmos — with a remarkable and astonishing power. YOU can use these sensors to illuminate the secrets of Nature, to probe the laws of physics in your immediate environment. These are the same laws of physics that govern distant galaxies, shape avalanches in the Rocky Mountains, explain the inner workings of your Kitchen-aid Mixer, drive the biorhythms of your cardiopulmonary system, and produce exploding garbage trucks on movie sets.  You live in a magical time in history, when the tricorder in your pocket lets you see the world around you anew, to ask questions like: how is my voice different from Barry White’s? Why is this light yellowish looking and this light is bluish looking? How high of a shelf can an egg fall off of without serious damage occurring? There are a variety of apps for your phone that will let you probe the various sensors.  Let’s look at some awesome capabilities that those apps enable.

ACCELERATION. Acceleration is the rate at which your motion is changing — if you are changing direction or speeding up or slowing down, you are accelerating.  Our perception of motion naturally has three possible directions: up/down, left/right, and forward/back, and your phone has 3 sensors (“accelerometers”), one for each of these directions. If I put my phone in my pocket, and start walking, sometimes the phone is moving up, but then changes direction and is moving down.  The gait of my walk means my hips twist and turn, so sometimes the phone is moving left and sometimes right.  The lines shown here represent the three changing motions of the phone as I walk across the room.  I can also find out what happens to my phone when I drop it on the (carpeted) floor.  The sudden sharp accelerations are the phone suddenly going from moving very fast to moving hardly at all (read: SMACK! Yes, I dropped my phone on the floor, just for you.).

(L) Acceleration profile of me walking across the room, phone in my pocket. (R) Acceleration of my phone hitting the carpeted floor, having been dropped from waist height.

(L) Acceleration profile of me walking across the room, phone in my pocket. (R) Acceleration of my phone hitting the carpeted floor, having been dropped from waist height.

Vibrations are easy to capture; if I lay my phone on a table, then sharply pound on it, the phone can sense the small bouncing motions, shown in the video here.  There are many uses for being able to measure acceleration.  You can capture other interesting graphs by running the sensors when you are a passenger in a car, when you ollie on your board, or by setting your phone on the washing machine when it is running.

Screen capture using Soundbeam app of a speaking voice. Video with audio here.

Screen capture using Soundbeam app of a speaking voice. Video with audio here.

SOUND. Sounds are a form of wave. Different sounds have different wave shapes. The shapes of those waves entering your ear is what allows you to distinguish different sounds from one another. It’s why your voice and my voice sound different from one another. The microphone on your phone captures sounds, and what it senses can be plotted to show you the wave shapes.  Sounds like the human voice have many different waves all added together, so the wave plots are jagged and non-uniform, rising and falling as we make words, change pitch and tone, and shape sound.

Screen shot using Soundbeam app of a whistle, a pure wave tone. Video of whistling different tones here.

Screen shot using Soundbeam app of a whistle, a pure wave tone. Video of whistling different tones here.

By contrast, some sounds are pure tones — a single wave that has a smooth repeating wave shape when plotted. A whistle is a good example (to the extent that one can maintain even pitch and tone when whistling).  Here is a movie of the waveforms when I am (attempting) whistling at different constant tones.  Low pitched sounds have wider wave shapes; high pitched sounds have narrower wave shapes.  When you hear a low pitch sound, fewer little wave bumps are entering your ear and impinging on your eardrums. When you hear a high pitched sound, lots of little wave bumps are entering your ear.

MAGNETIC FIELDS.  We are surrounded by magnetic fields. The Earth has a very prominent magnetic field that we have exploited for navigation for a millennium or more. We use magnetic fields to stick lottery tickets and children’s drawings to refrigerators. You’ve probably unknowingly encountered magnetic fields out in the world. Have you ever exited a parking lot, and had an automatic gate open as you approach it? These gates usually sense a magnetic field associated with the metal in your car.

Your phone uses the magnetometer as an electronic compass, but you can use those sensors to probe one of the first discoveries of modern physics — that electricity and magnetism are connected!  In the early 1800’s, physicists thought electricity and magnetism were two completely different things. Then in 1819, Hans Christian Ørsted discovered that electric currents could deflect magnets! This was a watershed discovery that was followed up by many others including Faraday, Ampere, Henry, and Maxwell.  The outcome was the first great unification in physics, of electricity and magnetism into a single theory called (remarkably!) electromagnetism. You can probe the same discovery as Ørsted using your smartphone. I was able to use my phone’s magnetometer to sense the power cord to my laptop, but you get dramatic results by moving your phone around a high power electrical device like your television set!

(L) Magnetometer reading as I push my tricorder toward the power cord to my laptop [which is SO Twentieth Century!]  Video here.  (R) Magnetometer reading as I move my tricorder around the back of my flat screen TV.  What is in there?  Video here.

(L) Magnetometer reading as I push my tricorder toward the power cord to my laptop [which is SO Twentieth Century!] Video here. (R) Magnetometer reading as I move my tricorder around the back of my flat screen TV. What is in there? Video here.

But there is a mystery here — I get a reading even if the television is off. What is in there?! I’ll need a screwdriver to find out… 🙂  What else can you discover in your house with strong magnetic fields?

LIGHT. One of the most important tools in science, particularly in astronomy, is spectroscopy — the study of different colors of light emitted by different materials. Everything that we have ever seen in the Cosmos is comprised of combinations of 92 naturally occurring materials, that we call “elements.”  Each of these elements emits light in a characteristic set of colors, a fingerprint that uniquely identifies one element compared to another.

The visible light fingerprints ("atomic spectra") of all the known chemical elements. Each atom emits and absorbs these unique sets of colors, making it possible to identify them.

The visible light fingerprints (“atomic spectra”) of all the known chemical elements. Each atom emits and absorbs these unique sets of colors, making it possible to identify them.

It was a deep understanding of the spectra of the stars that allowed Cecilia Payne-Gaposchkin to brilliantly deduce in 1925 that the stars were mostly hydrogen and helium in her PhD thesis.

Cecilia Payne Gaposchkin, the first person to understand what the stars are made of.

Cecilia Payne Gaposchkin, the first person to understand what the stars are made of.

When you look at a lightbulb, or a star, you perceive a particular hue, a shade of color that your eye feeds to your brain. But if you pass that light through a prism, the light divides itself into a cacophony of colors that all mixed together to produce the hue you saw. You can break light up by passing it through a prism, or through a diffraction grating (modern diffraction gratings are thin, transparent plastic with hundreds of finely spaced grooves that allow it to behave very similarly to a prism when light passes through it).

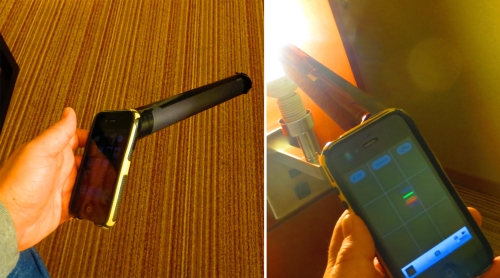
My tricorder, Macgyvered into a spectrometer using instructions with the spectraSnapp application.

My tricorder, Macgyvered into a spectrometer using instructions with the spectraSnapp application.

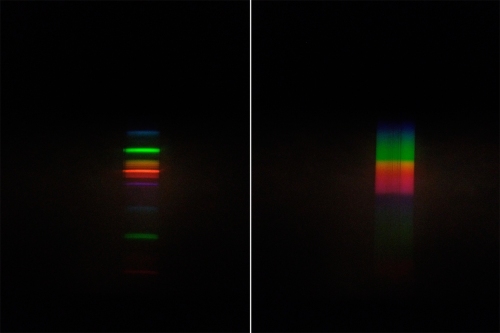
My colleagues at the American Physical Society have just created an awesome and simple modification of your phone that will let you not just take pictures, but capture, measure and identify spectra of different light sources using your phone.  The app is called spectraSnapp.  The app includes instructions on how to MacGyver a simple attachment from construction paper, tape, and a piece of diffraction grating (which could be MacGyvered to any phone, not just an iPhone).  This makes it possible to capture very clean spectra, like those shown below.

Sample spectra taken with my tricorder. (L) The line spectrum from a common compact fluorescent bulb. (R) The continuous spectrum from a traditional incandescent bulb.

Sample spectra taken with my tricorder. (L) The line spectrum from a common compact fluorescent bulb. (R) The continuous spectrum from a traditional incandescent bulb.

If I use the analysis suite built into spectraSnapp, it would seem that I’m looking at the spectrum of a compact fluorescent bulb (but I knew that! 🙂 ), and that the bright lines I captured are the brightest lines in the spectrum of mercury.

The spectraSnapp analysis screen lets you compare your spectrum to reference spectra. It seems my spectrum looks a lot like a compact fluorescent bulb (L), and that there is mercury in it (R).

The spectraSnapp analysis screen lets you compare your spectrum to reference spectra. It seems my spectrum looks a lot like a compact fluorescent bulb (L), and that there is mercury in it (R).

The number of possible experiments and explorations you can do with this technology in your hand is limited only by what you can think to do.  Want to know how loud the neighbor’s ZZ Top Airband party is? There’s a sensor and app for that. Want to know how many g’s you pull in an express elevator to the 67th floor? There’s a sensor and an app for that. Want to know how “do not disturb” that new mattress really is if you jump on it? There’s a sensor and an app for that.

Technology and smartphones have transformed our world in unprecedented ways. Sure they give you something to do when you’re eating lunch at a hot dog stand by yourself, but they also give you ways to better understand the world around you, and through that understanding, to improve your lives.  So pull your tricorder out of your pocket; you’ve been selected to lead an away team, and the world is right outside your door!

NOTES: The apps I used for writing this blog were all used on an iPhone 4S. There are many others that could be used as well.  Similar apps must exist for Droid users.  The apps I used were:

  • Sensor Kinetics (LINK)
  • Soundbeam (LINK)
  • spectraSnapp (LINK)

The Size of the Cosmos

by Shane L. Larson

As many of you know, I ascribe much of my aspirations in life as a scientist to being exposed to Cosmos at a very early age.  Within the first five minutes of the first episode, Carl said a very big thought: “The size and scale of the Cosmos are beyond ordinary human comprehension.”

As I have grown into my career in science, I have lost sight of this simple fact. I’ve learned to write big numbers. I’ve learned to convert between meters and kilometers and lightyears when needed. I’ve even learned to use “crazy relativist units” and measure distance, time, energy and mass all in meters (something that confounds my students, my parents, and many of my astronomer friends!). I’ve done this enough now that when I calculate numbers, I know if they sound right.  Two million lightyears to a galaxy in the Local Group? Sure that sounds fine.  750 Megaparsecs to a quasar? Sure, I’m down with that.  1.3 billion kilometers to Saturn?  Word.

Developing a sense for big (and small!) numbers and whether they “sound right” is an essential skill for scientists, and we spend inordinate amounts of time training ourselves and our students to be facile with them.  But that completely bypasses Carl’s point — these numbers are HUGE.  They encode how utterly small we are on the grand scale of the Cosmos!

One of my hobbies is walking Solar System Walks when I encounter them (here is a long list at Wikipedia; another list at Air & Space).  These scale models lay out the Solar System, marking the location of planets at the appropriate spatial scale to give you a sense of how large the Solar System is (forget the Universe itself).  My favorite is one in Anchorage, Alaska, known as the “Lightspeed Planet Walk”  — if you walk at normal speed, the time it takes you to reach each planet is the same time it would take light to make the journey you made.  That is awesome.  Start at Earth, and shine a laser pointer at Neptune the moment you start walking; you’ll reach Neptune at the same time your feeble green laser beam reaches the real planet Neptune!

The center of the Lightspeed Planet Walk in Anchorage, Alaska, with a scale model of the Sun.

The center of the Lightspeed Planet Walk in Anchorage, Alaska, with a scale model of the Sun.

Despite the large physical scale of these walking models, I still often feel like they don’t capture the immensity in a way that really shocks my brain. I’ve thought about this fact a lot, and suspect it is because when I’m walking the model, it feels quite ordinary.  As I’m meandering from Mars to Jupiter, I’m not really thinking about how far I’m walking. I’m distracted by my daughter prattling about why Pluto should still be a planet, and watching ducks eat algae, and avoiding speeding mountain bikers.

But a couple of weeks ago, one of my astronomy friends showed me something that blew my socks off.  It’s a very simple demonstration you can do right at home that captures how messed up my mental picture (and I’ll bet yours!) of the solar system is!  I think my mental pictures are messed up because we often show the family of the Sun all together, to better show the relative size of the planets, like the image below.

A typical representation of the Solar System, often used in books, online references, and mass media.

A typical representation of the Solar System, often used in books, online references, and mass media.

What this image fails to show, is the spacing between the worlds.  We’ve known the relative spacing of the planets for some time, the distances having been worked out using basic geometry together with clever observations (many of which can easily be done in your own backyard), and through application of the laws of physics (notably Kepler’s Laws of Motion, and Newton’s Universal Law of Gravitation).

Folding pattern to make a reasonably spaced representation of the planetary orbits in the Solar System on a long strip of paper.

Folding pattern to make a reasonably spaced representation of the planetary orbits in the Solar System on a long strip of paper.

Let me teach you the trick my friend showed me.  Get a long strip of paper (adding machine paper, or other strip paper works well), about 1 meter long.  On one end, write the word SUN and on the other end write PLUTO.  Now fold the strip in half, and unfold it again.  What object in the solar system lies halfway between the Sun and Pluto?  It is the planet Uranus; write this on the fold.  Now fold the end marked Pluto down to Uranus.  Label this as the location of the orbit of Neptune.  What does this show us?  There isn’t  much in the way of planets in the outer half of the solar system!

Now fold the end marked Sun down to Uranus.  On  this new fold write Saturn.  Fold the Sun down to  Saturn and label the new fold Jupiter.  Fold the  Sun to Jupiter and label the new fold  Asteroids.  At this point, about 93% of your strip is  between the asteroids and Pluto.  This is the part of the solar  system that is euphemistically called “The Outer Solar  System.”  Fully half of the known planets in the solar  system are still to be squeezed between the Asteroids and  the Sun!  Let’s do that next.

Fold the Sun to Asteroids, and label this fold  Mars.  The last part is two folds before labeling: fold the Sun to Mars, then fold the end over to Mars again.  The result is three folds.  Starting at the  Sun, label them Mercury, Venus and Earth.  The entire procedure creates a map with amazingly accurate spacing between the worlds (yes! I calculated the errors; I was curious!).

The results of all your folding endeavours!

The results of all your folding endeavours!

Now stare at your model for a moment.  The solar system is a lot of empty space!  The places that are easiest to get to are close to Earth, but are still very far away.  The distance to the Moon is about the width of a pencil line, and it took Apollo astronauts 4 days to cross that gulf.  Mars is six to eight months away by rocket.  Look how close it is to Earth!  It took the Cassini spacecraft almost seven years to get to Saturn.   When the New Horizons spacecraft flies by Pluto in 2015, it  will be have been outbound for almost nine-and-a-half years!  The  solar system is a big place. And the Cosmos is far vaster.

I think what amazes me the most about this model is that places I normally think of as very far away are much closer to Earth than my brain normally thinks of them.  Consider Jupiter; it is in the Outer Solar System.  But on the map, it is only 1/8th the distance between the Sun and Pluto!  Wow.

“The size and scale of the Cosmos are beyond ordinary human comprehension.”  Perhaps; certainly outside the realm of our everyday experiences. But our ingenuity gives us ways to push our brains to try to understand, and clever demonstrations like this one give you ways to ponder and think.  So get out your scissors, and start folding.

(L) The full length of the Solar System model. (R) My own version of this model, shown next to a typical Earthling.

(L) The full length of the Solar System model. (R) My own version of this model, shown next to a typical Earthling.

A Personal Voyage

by Shane L. Larson

Today would have been Carl Sagan’s 78th birthday.  This December, it will have been sixteen years since he left us, returned to the star stuff from whence we all came. I was first exposed to Carl in the fall of 1980, a few weeks after my eleventh birthday.  Cosmos was broadcast for the first time that fall, and my parents somehow had known to sit me down in front of our boxy television set and let me be enchanted by Carl’s poetic rapture with everything that is, or was, or ever will be.

Cosmos was not full of the dry, pithy rigidity most of us remember from our science classes.  Carl was a master of exposing the magic of science, seemingly unafraid of voicing the inner wonder that the beauty of the natural world inspires, carrying us along on his personal voyage with flair and poetic majesty.  Many of my scientific colleagues find the lyrical narrative of Cosmos annoying and disingenuous.  They feel like it belittles science, taking away some of the deep meaning of our quest to understand the secrets of Nature. But for myself, I find it exhilarating and uplifting; to this day it has the power to enchant me.  Language, like science, is one portal into the human spirit, and it is the only way by which we can communicate the wonder and mystery of the Cosmos from one person to another. It’s not grandiloquence; it’s a passionate attempt to express the deep inspiration and magic of Nature that moves us as scientists.

If there is any essential consequence of my exposure to Cosmos, it is that Carl’s voice is the voice that rings in my head when I read almost anything about science. When my profession has been boxing me soundly about the ears, or I get depressed about the state of science literacy in modern America, or I need some simple soul massage, I always turn to Cosmos.  It lifts my spirits, it reminds me of why I do this — why I do science — in the first place. In many ways, Cosmos is why I write for this blog every month.  I aspire (perhaps foolishly) to provide a mechanism for someone else to discover science, the way Carl helped me discover science.

So, in honor of Carl’s birthday, let me tell you about one small weave from the tapestry science. This is a story that evokes in me a little bit of wonder about the natural world, and astonishes me with the ingenuity of our curious young species. This is a story about how we have come to understand the bejeweled structure of matter.

One of the great wonders of modern science is that we have extended our ability to see far beyond the reach of the senses that Nature provided us through a billion years of biological evolution.  There are many places our curiosity leads us to where our biological sensors are simply not designed to work. This is the case when we peer deep into the vast reaches of the Cosmos, and it is the also the case when we peer inward to see the microstructure of the world.  In both cases, we have invented technology that allows us to see.

Suppose we look inward.  What is the matter around us made from?  How is it put together?  Are the micro properties of matter connected to the things that I can see on the scale of fuzzy bunny slippers and wine glasses and fly swatters?  Most of us at some point early in our education learn that the world is made of atoms, and learn to draw the classic picture of atoms as a dot (the nucleus) ringed by a set of ellipses threading other beady little dots (electrons).  Another axiom that we learn is that the stuff of the world is actually made from connected groups of atoms, called molecules.  How do we know that?

Crystals of table salt showing cubic symmetry (left), and snowflakes showing hexagonal symmetry (right).

That matter has underlying structure seems almost obvious when you look at some objects.  A single crystal of table salt has spectacular cubelike symmetry; snowflakes unerringly show hexagonal symmetry.  Many states of matter form themselves into regular structures that physicists call a lattice.  The exact shape and layout of the lattice depends on the properties of the atoms that make it up.  Salt crystals are made up of an alternating array of sodium and chlorine atoms.  Atoms use electrons as hooks to link themselves together (something our friends in chemistry call “valence bonds”), and where those hooks are in the atom affects the shape of molecules that include the atom.  Sodium and chlorine can link together in straight lines, and so naturally settle into a rectangular form when piled together.

A model of the lattice of table salt (sodium chloride, left) and of a water molecule (right).

By contrast, snowflakes are made from water molecules, which are comprised of a single oxygen atom bound to two hydrogen atoms.  The structure of the hooks on the oxygen atom keeps the hydrogen atoms from lying in a straight line, so the molecule ends up being bent at an angle of 120 degrees. That angle is one of the symmetry angles of a hexagon!  When you lay water molecules down together to form the ice crystal of the snowflake, they naturally take on the famous hexagonal symmetry because that is the easiest way to lay side by side.

It sounds plausible and reasonable, but how do we know this? Atoms and molecules are far too small to be seen by human eyes, but being clever students of the natural world we have learned how to use other physical phenomena as probes that are capable of teasing out mysteries that our eye cannot discern. One such phenomenon that can be exploited for this purpose is light, particularly light that we cannot see with our eyes, like x-ray light.  X-ray light is very energetic, and it can fit into very small areas (like the spaces between atoms!).  If one illuminates a material, like a salt crystal, with x-ray light, the light worms its way into the spaces between the atoms then bounces out of the crystal where it combines with x-ray light that bounces out of other parts of the crystal.  The result is a dizzying array of bright dots whose spacing and geometry are a representation of the structure of the crystal.

A single salt crystal (left) will, when illuminated with xrays, create a geometric pattern representative of the underlying crystal structure.

You can do a similar experiment at home with a CD and a laser pointer. If you shine the laser pointer on the surface of a CD and look at the reflection on the wall, you’ll see an array of dots — the spacing of those dots depends on the structure of the tracks on the CD that encode the music you listen too.

You can probe the structure of a CD using a laser pointer at home. The pattern is called a diffraction pattern.

Perhaps the most famous and inspiring picture taken of matter by this technique is an image known as “Photo 51.” It was taken in 1952 by a young scientist named Rosalind Franklin and her research student, Raymond Gosling. It is the first picture ever taken of DNA, the master molecule of all life on Earth.  Before Franklin’s work, the double helix structure of DNA was unknown.

Rosalind Franklin (left) and the famous Photo 51 (right) that revealed the double helix structure of DNA.

The structure of DNA had been hinted at, but the geometry and shape were confused.  Franklin had been the first person to understand that the nucleotide bases pointed inward from the double helix spine, a fact that she had personally relayed to Francis Crick and James Watson.  Unknown to Franklin, Photo 51 had been shown to Watson, a turning point event that helped inform Watson and Crick’s  ultimate deduction of the double helix structure.  Franklin and Gosling’s paper on the structure of DNA was one of three that were published simultaneously in the journal Nature in 1953.  Franklin went on to continue her work in imaging, notably working on the characterization of the polio virus.  Sadly, she died of ovarian cancer in 1958, at the age of 37.  Watson and Crick, together with their colleague Maurice Wilkinson, were awarded the Nobel Prize in 1962 for the discovery of the structure of DNA.

Franklin’s story, like so many tales of scientific discovery, is now lost to us, taken when she died. We can’t know the wonder she and Gosling must have felt when the shadows of the double helix first emerged from their film, but we can imagine.  It is that imagining that is important now, long after the glow of discovery has faded. Imagining the simple joy of discovery after a long personal voyage; imagining those few moments when you and no one else knows some deep secret wrested from Nature.  Those are altogether human moments, when our scientific minds are flooded with endorphins and overwhelmed by the joy of discovery.  Those are the moments that we live for.